Charts
Users can plot an arbitrary chart as a CivilFEM tab. The following example illustrates how to create, configure and plot a 2D chart:
# -*- coding: utf-8 -*-
import math

# Function definition to use by the example
def wind_force(argZ):
	z = float(argZ)
	if (z <= 1.0):
		return 385.0
	else:
		return 385.0 * (1.0 + math.log(float(z)))

# Chart object creation
userGraph = CreateUserGraph()

# Chart configuration
userGraph.setTitle("Wind force N/m")
userGraph.setXAxisLabel("Force N/m")
userGraph.setYAxisLabel("Height (m)")

# This is the type of chart to use, check other types at the end
userGraph.setCategory("ChartLine")

# Chart data, calling the function wind_force previously defined
pointsX = []
pointsY = []
for height in range(1,40):
	pointsY.append(float(height))
	pointsX.append(wind_force(height))

userGraph.addSerie2D("Wind force N/m", "Circle", pointsX, pointsY)

# Plot of the chart
userGraph.plot()
The following chart is obtained:
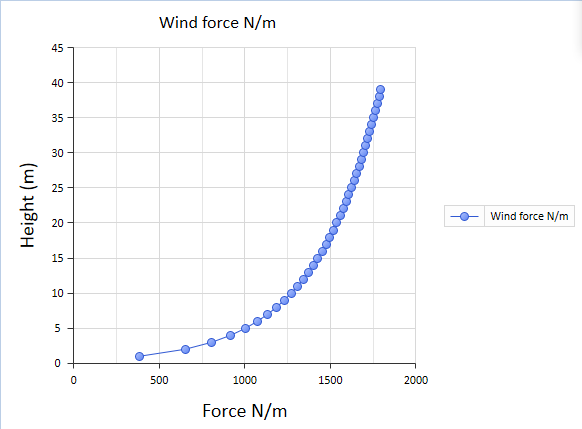
Other chart types, to use with the method setCategory, for 2D data are: ChartLine, ChartColumn, ChartBar, ChartHistogram, ChartArea, ChartStock, ChartLongData, ChartPolar, ChartColumn3D, ChartBar3D, ChartArea3D.