Excel
Working with Excel files can be a productive option using CivilFEM’s Python.
Imports
# -*- coding: utf-8 -*-

# Math
import math

# Openpyxl imports
from openpyxl import Workbook
from openpyxl import load_workbook
from openpyxl.chart import (
	ScatterChart,
	LineChart,
	Reference,
	Series
)
Creating an excel file
# This variable is used to the number of the maximum row
maxOutputRow = 10

workbook = Workbook()
worksheet = workbook.active
worksheet.title = 'Heights'

# To write a value in a cell, set the row and column, and set the value
worksheet.cell(row=3,column=2).value = 'Heights'
worksheet.cell(row=3,column=3).value = 'Forces'
worksheet.cell(row=3,column=4).value = 'Half Forces'

# Fill the column of heights
height = 1.0
for i in range(4,maxOutputRow + 1):
	worksheet.cell(row=i,column=2).value = height
	height = height + 0.5

# To save the excel file, just call the save method with a file path:
workbook.save(r'E:\Heights.xlsx')
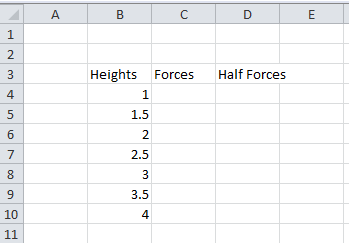
The generated excel file has this content:
Loading an excel file
# Loading an existing excel file
workbookOutput = load_workbook(r'E:\Heights.xlsx')

# Taking a sheet from the excel
worksheet = workbookOutput["Heights"]
Filling an excel with data
# Function definition to use by the example
def wind_force(argZ):
	z = float(argZ)
	if (z <= 1.0):
		return 385.0
	else:
		return 385.0 * (1.0 + math.log(float(z)))

# The rows are iterated in the output to fill them
for i in range(4, maxOutputRow + 1):
	# We get the height from the column 2
	height = float(worksheet.cell(row=i,column=2).value)

	# We calculte the force and half force
	force = wind_force(height)
	half_force = force * 0.5

	# To write a value in a cell, set the row and column, and set the value
	worksheet.cell(row=i,column=3).value = force
	worksheet.cell(row=i,column=4).value = half_force
Creating a chart
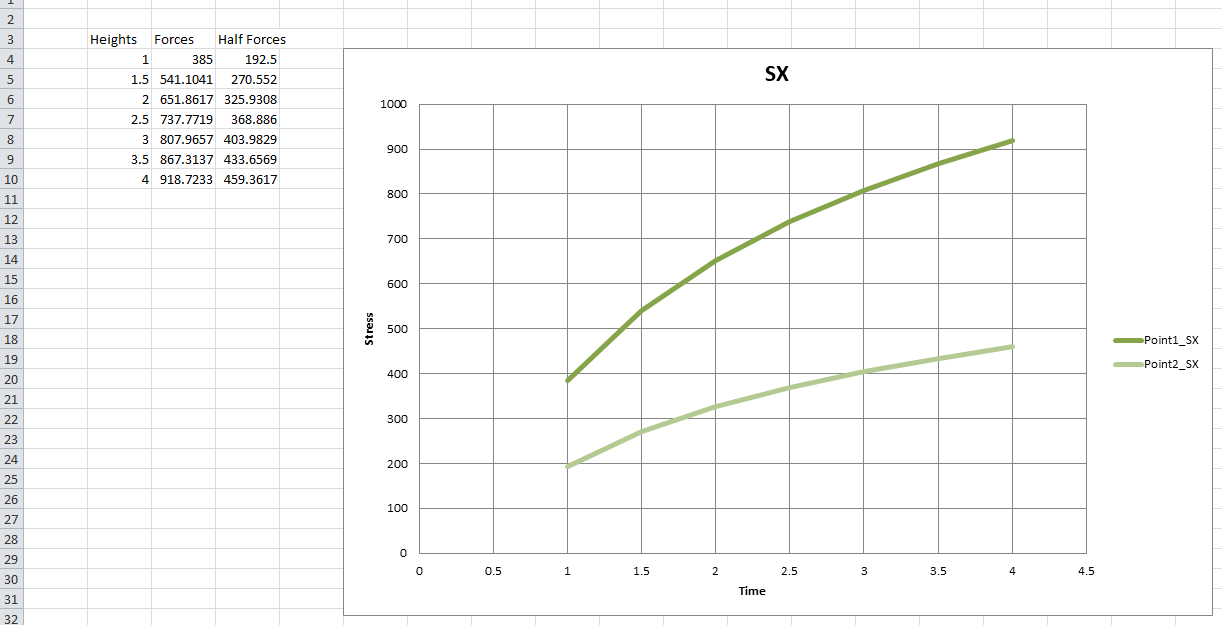
Inside an excel file we can store a chart. The following Python code illustrates the process:
# Chart title
chartTitle = "SX"

# Position for the chart
position="F4"

# Basic chart configuration
chart = ScatterChart()
chart.title = chartTitle
chart.style = 13
chart.y_axis.title = 'Stress'
chart.y_axis.delete = False
chart.x_axis.title = 'Time'
chart.x_axis.delete = False

# Each serie title
seriesTitle = ["Point1", "Point2"]

# We iterate for each serie taking the data already stored in columns 2 (for x_axis) and 3, 4
# (for y_axis values for each serie)
# Note: maxOutputRow defines the number of the maximum row to take
for i in range(len(seriesTitle)):
	xvalues = Reference(worksheet, min_col = 2, min_row = 4, max_row=maxOutputRow)
	yvalues = Reference(worksheet, min_col = 3 + i, min_row = 4, max_row=maxOutputRow)
	series = Series(values = yvalues, xvalues = xvalues, title = seriesTitle[i] + "_" + chartTitle)
	series.smooth = False
	# Optional color: series.graphicalProperties.line.solidFill = "000000"
	series.graphicalProperties.line.width = 50050 # width in EMUs
	chart.series.append(series)

# To set the size of the chart
chart.height = 15 # default is 7.5
chart.width = 23 # default is 15

# Adding the chart to a loaded sheet
worksheet.add_chart(chart, position)


Saving the excel
To save the excel file, just call the save method with a file path:

workbookOutput.save(r'E:\Stress_Output.xlsx')
This is the output excel file: