

- CivilFEM Documentation
- CivilFEM Commands Reference
- A commands
- B commands
- ~BLCBDEL
- ~BLCBEND
- ~BLCBLD
- ~BLCBPA
- ~BLCBST
- ~BLF2CMB
- ~BLFDEL
- ~BLFDF
- ~BLFLST
- ~BLPL
- ~BLPLPL
- ~BLSA
- ~BLSB
- ~BLSEND
- ~BLSOLVE
- ~BLSST
- ~BLSTF
- ~BLVA
- ~BLVB
- ~BLVC
- ~BLVD
- ~BLVDEL
- ~BLVEND
- ~BLVGEN
- ~BLVLIB
- ~BLVLST
- ~BLVMDF
- ~BLVR
- ~BLVST
- ~BLWRITE
- ~BMSHDEL
- ~BMSHGEN
- ~BMSHLST
- ~BMSHOFF
- ~BMSHPRO
- ~BRAC
- ~BRADDEL
- ~BRADDPL
- ~BRANG
- ~BRBC
- ~BRCS
- ~BRCSOPT
- ~BRDEF
- ~BRDELEL
- ~BRDELPL
- ~BRGEN
- ~BRHL
- ~BRHLDEL
- ~BRHLMDF
- ~BRINIP
- ~BRIQR
- ~BRMVDL
- ~BRPD
- ~BRPLST
- ~BRSBOX
- ~BRSCN
- ~BRSDEL
- ~BRSDIV
- ~BRSGEN
- ~BRSKTCH
- ~BRSLST
- ~BRSMDF
- ~BRSSLAB
- ~BRSTOCS
- C commands
- ~CALSERC
- ~CBDMS
- ~CFABOUT
- ~CFACTIV
- ~CFCLEAR
- ~CFCONFG
- ~CFEXIT
- ~CFFILE2
- ~CFFL3D
- ~CFGET
- ~CFHBRD
- ~CFHBWR
- ~CFLSSLV
- ~CFLSWRT
- ~CFMP
- ~CFMPDEL
- ~CFMPGEN
- ~CFMPLIB
- ~CFMPLST
- ~CFRAPPN
- ~CFRESUM
- ~CFSAVE
- ~CFSET
- ~CFVGET
- ~CFVLEN
- ~CFVMASK
- ~CHKCON
- ~CHKPRS
- ~CHKSTL
- ~CLPRD
- ~CMB
- ~CMBCLR
- ~CMBDAT
- ~CMBDEF
- ~CMBDEL
- ~CMBINQ
- ~CMBLST
- ~CMBMOD
- ~CMBPRM
- ~CMBSTAT
- ~CODESEL
- ~COMBINE
- ~COST
- ~COSTLST
- ~CPDEF
- ~CPSTDEF
- ~CRLTCOM
- ~CRLTDEF
- ~CRLTDEL
- ~CRLTLST
- ~CRLTUSE
- ~CSDEL
- ~CSECDMS
- ~CSGEN
- ~CSIQR
- ~CSLIB
- ~CSLST
- ~CSMRG
- D commands
- E commands
- F commands
- G commands
- H commands
- I commands
- L commands
- M commands
- P commands
- ~P_SPEC
- ~PCCBDEL
- ~PCCBEND
- ~PCCBPA
- ~PCCBST
- ~PCCTMDF
- ~PCDEL
- ~PCEPDEL
- ~PCEPDEF
- ~PCEPGEN
- ~PCEPMDF
- ~PCLOSS
- ~PCPL
- ~PCPLPL
- ~PCPPDEL
- ~PCPPDEF
- ~PCPPGEN
- ~PCPPMDF
- ~PCTNDEL
- ~PCTNDEF
- ~PCTNGEN
- ~PCTNLST
- ~PCTNMDF
- ~PCTYPE
- ~PL2DINT
- ~PL2DPRS
- ~PLCSBS
- ~PLCSCON
- ~PLCSEC3
- ~PLCSSTR
- ~PLFILE
- ~PLHBMAT
- ~PLHCLPF
- ~PLLSCON
- ~PLLSFOR
- ~PLLSPRS
- ~PLLSSTL
- ~PLLSSTR
- ~PLSEEP
- ~PLSHCLP
- ~PLSHCON
- ~PLSHFOR
- ~PLSHPRS
- ~PLSHSTR
- ~PLTEND
- ~PR2DINT
- ~PR2DPRS
- ~PRCON
- ~PRFOR
- ~PRHCLPF
- ~PRPRS
- ~PRSHCLP
- ~PRSTL
- ~PRSTR
- ~PUSHDEF
- ~PUSHLST
- ~PUSHMOD
- ~PUSHSLV
- R commands
- S commands
- ~SBBMDEF
- ~SBCANNT
- ~SBCLEAR
- ~SBLST
- ~SBPAR
- ~/SBSHOW
- ~SBSMDEF
- ~SBSMMDF
- ~SD2SH
- ~SEC2DIN
- ~SEC2DOU
- ~SECMDF
- ~SEEPAGE
- ~SEEPMOD
- ~SHLDEL
- ~SHLGEN
- ~SHLIPSH
- ~SHLLST
- ~SHLMDF
- ~SHLRNF
- ~SHLSHR
- ~SHLSTL
- ~SLDDEL
- ~SLDLST
- ~SLDMDF
- ~SLDSEC
- ~SLPCIR
- ~SLPCIRK
- ~SLPIN
- ~SLPINK
- ~SLPLST
- ~SLPOPT
- ~SLPPOL
- ~SLPPWP
- ~SLPSOL
- ~SLPTAN
- ~SLPTANK
- ~SSECDMS
- ~SSECLIB
- ~SSECPLT
- ~STSTCFT
- ~STSTDEF
- T commands
- U commands
- V commands
- W commands
- 6.1 CivilFEM Combinations
- 6.2 Results Combination in ANSYS and in CivilFEM
- 6.3 Basic Terminology
- 6.4 Types of Combination Rules
- 6.5 Data Groups
- 6.6 Envelopes
- 6.7 Concomitance at Load and Model Level
- 6.8 Comment about Beam188 and Beam189 Elements
- 6.9 Start State Combinations with Prestressing Tendons
- 6.10 Calculation of All Possible Load Cases
- 6.11 Automatic Load Combinations for Standards
- 11–A.1 Introduction
- 11–A.2 Predesign of Rectangular Sections
- 11–A.3 3D Interaction Diagram
- 11–A.4 Axial Load and Biaxial Bending Checking
- 11–A.5 Axial Load and Biaxial Bending Design (Reinforcement Factor)
- 11–A.6 Axial Load and Biaxial Bending Design (Reinforcement Amount)
- 11–A.7 Calculation Codes
- 11–A.8 Previous Considerations to Shear and Torsion Calculation
- 11–A.9 Shear and Torsion according to Eurocode 2 (ENV 1992–1–1:1991)
- 11–A.10 Shear and Torsion according to Eurocode 2 (EN 1992–1–1:2004/AC:2008) and ITER Design Code
- 11–A.11 Shear and Torsion according to ACI 318–05
- 11–A.12 Shear and Torsion according to ACI 318–14
- 11–A.13 Shear and Torsion according to ACI 318–19
- 11–B.1 Introduction
- 11–B.2 Shear and Torsion according to EHE–98
- 11–B.3 Shear and Torsion according to EHE–08
- 11–B.4 Shear and Torsion according to BS8110
- 11–B.5 Shear and Torsion according to AS3600
- 11–B.6 Shear and Torsion according to GB50010–2002
- 11–B.7 Shear and Torsion according to GB50010–2010
- 11–B.8 Shear and Torsion according to NBR6118
- 11–B.9 Shear and Torsion according to AASHTO Standard Specifications for Highway Bridges
- 11–B.10 Shear and Torsion according to Code of Rules 52–101–03 and SP 63.13330.2012
- 11–B.11 Shear and Torsion according to IS 456
- 11–C.1 Introduction
- 11–C.2 Shear and Torsion according to ACI 349–01 y ACI 349–06
- 11–C.3 Shear and Torsion according to ACI 349–13
- 11–C.4 Cracking Analysis
- 11–C.5 Cracking Checking according Eurocode 2 (ENV 1992–1–1:1991)
- 11–C.6 Cracking Checking according Eurocode 2 (EN 1992–1–1:2004/AC:2008) and ITER Design Code
- 11–C.7 Cracking Checking according to ACI 318–05 and ACI 318–14
- 11–C.8 Cracking Checking according to EHE (EHE–98 and EHE–08)
- 13.1 General Concepts
- 13.2 Design for Bending Moment and Torsion – Wood–Armer Method
- 13.3 Design under Bending Moment and In Plane Loading – CEB–FIP Method
- 13.4 Design according to the Orthogonal Directions Method
- 13.5 Design according to the Most Unfavorable Direction Method
- 13.6 Check and Design for Out–of–Plane Shear Loadings according to Eurocode 2 (ENV 1992–1–1:1991)
- 13.7 Check and Design for Out–of–Plane Shear Loadings according to Eurocode 2 (EN 1992–1–1:2004/AC:2008) and ITER Design Code
- 13.8 Check and Design for Out–of–Plane Shear Loadings according to EHE–98
- 13.9 Check and Design for Out–of–Plane Shear Loadings according to EHE–08
- 13.10 Check and Design for Out–of–Plane Shear Loadings according to Code of Rules 52–101–03 and SP 63.13330.2012
- 13.11 Check and Design for Out–of–Plane Shear Loadings according to ACI 318–05
- 13.12 Check and Design for Out–of–Plane Shear Loadings according to ACI 318–14
- 13.13 Check and Design for Out–of–Plane Shear Loadings according to ACI 318–19
- 13.14 Check and Design for Out–of–Plane Shear Loadings according to ACI 349–01 and ACI 349–06 (Reinforced Concrete)
- 13.15 Check and Design for Out–of–Plane Shear Loadings according to ACI 349–13 (Reinforced Concrete)
- 13.16 Check and Design for In–plane Shear Loadings according to ACI 349–01and ACI 349–06
- 13.17 Check and Design for In–plane Shear Loadings according to ACI 349–13
- 13.18 Check and Design according to ACI 359–04 (Reinforced Concrete)
- 13.19 Check and Design according to ACI 359–04 (Prestressed Concrete)
- 13.20 Cracking Checking according Eurocode 2 (EN 1992–1–1:2004/AC:2008)
- 13.21 Cracking Checking according to ACI 318–05, ACI 318–14 and ACI 318–19
- 13.22 Cracking Checking according to Code of Rules 52–101–03 and SP 63.13330.2012
- 14.1 Introduction
- 14.2 Spectrum Calculation according to Eurocode 8 (ENV–1998–1–1:1994)
- 14.3 Spectrum Calculation according to Eurocode 8 (EN–1998–1:2004)
- 14.4 Spectrum Calculation according to NCSE–94
- 14.5 Spectrum Calculation according to NCSE–02
- 14.6 Spectrum Calculation according to GB50011
- 14.7 Spectrum Calculation according to GB50011–2010
- 14.8 Spectrum Calculation according to IT3274
- 14.9 Spectrum Calculation according to AASHTO LRFD Bridge Design Specifications
- 14.10 Spectrum Calculation according to EAK 2000
- 14.11 Spectrum Calculation according to CALTRANS Seismic Design Criteria
- 14.12 Spectrum Calculation according to the Uniform Building Code (1997)
- 14.13 Spectrum Calculation according to PS 92
- 14.14 Spectrum Calculation according to the Indian Standard 1893
- 14.15 Modal Analysis of the Structure
- 14.16 Modes Combination
- 14.17 Push Over Analysis
- 14.18 Seismic Safety Margin
- 17–A.1 Introduction
- 17–A.2 Definition of Layered Soils
- 17–A.3 Ballast Module
- 17–A.4 Retaining Walls 1 ½ D
- 17–A.5 Slope Stability
- 17–A.6 Mohr–Coulomb Plasticity Model
- 17–A.7 Cam–Clay Plasticity Model
- 17–A.8 Hoek and Brown's Failure Criteria
- 17–A.9 Seepage
- 17–A.10 Earth Pressures
- 17–A.11 Terrain Initial Stress
- /SBSHOW
- ACTMAT
- ACTTIME
- ALTER
- BLCBDEL
- BLCBEND
- BLCBLD
- BLCBPA
- BLCBST
- BLF2CMB
- BLFDEL
- BLFDF
- BLFLST
- BLPL
- BLPLPL
- BLSA
- BLSB
- BLSEND
- BLSOLVE
- BLSST
- BLSTF
- BLVA
- BLVB
- BLVC
- BLVD
- BLVDEL
- BLVEND
- BLVGEN
- BLVLIB
- BLVLST
- BLV;DF
- BLVR
- BLVST
- BLWRITE
- BMSHDEL
- BMSHGEN
- BMSHLST
- BMSHOFF
- BMSHPRO
- BRAC
- BRADDEL
- BRADDPL
- BRANG
- BRBC
- BRCS
- BRCSOPT
- BRDEF
- BRDELEL
- BRDELPL
- BRGEN
- BRHL
- BRHLDEL
- BRHLMDF
- BRINIP
- BRIQR
- BRMVDL
- BRPD
- BRPLST
- BRSCN
- BRSDEL
- BRSDIV
- BRSGEN
- BRSKTCH
- BRSBOX
- BRSLST
- BRSMDF
- BRSSLAB
- BRSTOCS
- CALSERC
- CBDMS
- CFABOUT
- CFACTIV
- CFCLEAR
- CFCONFG
- CFEXIT
- CFFILE2
- CFFL3D
- CFGET
- CFHBRD
- CFHBWR
- CFLSSLV
- CFLSWRT
- CFMP
- CFMPDEL
- CFMPGEN
- CFMPLIB
- CFMPLST
- CFRAPPN
- CFRESUM
- CFSAVE
- CFSET
- CFVGET
- CFVLEN
- CFVMASK
- CHKCON
- CHKPRS
- CHKSTL
- CLPRD
- CMB
- CMBCLR
- CMBDAT
- CMBDEF
- CMBDEL
- CMBINQ
- CMBLST
- CMBMOD
- CMBPRM
- CMBSTAT
- CODESEL
- COMBINE
- COST
- COSTLST
- CPDEF
- CPSTDEF
- CRLTCOM
- CRLTDEF
- CRLTDEL
- CRLTLST
- CRLTUSE
- CSDEL
- CSECDMS
- CSGEN
- CSIQR
- CSLIB
- CSLST
- CSMRG
- DAHEAD
- DASEEP
- DEFSPEC
- DIMCON
- DIMPRS
- DIMPRS
- DIMSTL
- DLHEAD
- DLSEEP
- EFFPRES
- EFSAPPL
- EFSCALC
- EFSLST
- ENVDEF
- ENVDEL
- ENVELOP
- ETHSF
- ETHSFE
- FL3DRES
- FMREAD
- FMWRITE
- FRMBS
- FRMCPY
- FRMCR
- FRMDEF
- FRMDEL
- FRMGEN
- FRMGT
- FRMLDS
- FRMLST
- FRMMDL
- FRMVHS
- FRTRCK
- GENSPEC
- GENTEN
- GRCSBS
- GRCSCON
- GRCSEC3
- GRCSSTR
- GRSLPD
- GRSLPR
- GTPD
- HBSOLVE
- HCLPFCN
- HCLPFST
- IDHCLPF
- ILCLOSE
- ILOPEN
- ISOBAR
- L_MOD
- L_SPEC
- LINCMB
- LINLST
- LPRNSOL
- LPSOLVE
- LSTFMT
- MEMBDEL
- MEMBGEN
- MEMBLST
- MEMBPRO
- MOD_SF
- MODLSOL
- P_SPEC
- PCCBDEL
- PCCBEND
- PCCBPA
- PCCBST
- PCCTMDF
- PCDEL
- PCEPDEF
- PCEPDEL
- PCEPGEN
- PCEPMDF
- PCLOSS
- PCPL
- PCPLPL
- PCPPDEF
- PCPPDEL
- PCPPGEN
- PCPPMDF
- PCTNDEF
- PCTNDEL
- PCTNGEN
- PCTNLST
- PCTNMDF
- PCTYPE
- PL2DINT
- PL2DPRS
- PLCSBS
- PLCSCON
- PLCSEC3
- PLCSSTR
- PLFILE
- PLHBMAT
- PLHCLPF
- PLLSCON
- PLLSFOR
- PLLSPRS
- PLLSSTL
- PLLSSTR
- PLSEEP
- PLSHCLP
- PLSHCON
- PLSHFOR
- PLSHPRS
- PLSHSTR
- PLSHPRS
- PLTEND
- PR2DINT
- PR2DPRS
- PRCON
- PRFOR
- PRHCLPF
- PRPRS
- PRSHCLP
- PRSTL
- PRSTR
- PUSHDEF
- PUSHLST
- PUSHMOD
- PUSHSLV
- RCVWRT
- REDEF
- REDEL
- RETROFT
- RNFDEF
- RNFMDF
- SBBMDEF
- SBCANNT
- SBCLEAR
- SBLST
- SBPAR
- SBSMDEF
- SBSMMDF
- SD2SH
- SEC2DIN
- SEC2DOU
- SECMDF
- SEEPAGE
- SEEPMOD
- SHLDEL
- SHLGEN
- SHLIPSH
- SHLLST
- SHLMDF
- SHLRNF
- SHLSHR
- SHLSTL
- SLDDEL
- SLDLST
- SLDMDF
- SLDSEC
- SLPCIR
- SLPCIRK
- SLPIN
- SLPINK
- SLPLST
- SLPOPT
- SLPPOL
- SLPPWP
- SLPSOL
- SLPTAN
- SLPTANK
- SSECDMS
- SSECLIB
- SSECPLT
- STSTCFT
- STSTDEF
- TENLD
- TERDEF
- TERDEL
- TERGEN
- TERLST
- TETHEX
- TIS
- TN2DIN
- TNADDEL
- TNADDPL
- TNADV
- TNGEN
- TNINIP
- TNSKTCH
- TPLST
- TPHASE
- TPOST
- TPSET
- TREFINE
- TRGDEF
- TRGDEL
- TRGLST
- TRGUPT
- TSOLVE
- TSTEP
- TTRUSS
- UNITS
- UPDATE
- VARTH
- VERIF
- VWHTML
- VWTXT
- VWXLS
- WALLANC
- WALLGEN
- WALLINI
- WALLJNT
- WALLMOD
- WALLSOL
- WALLSTP
- WATTAB
- WEIGHT
- WTSLP
- WTSOLVE
Slope stability results
The results obtained from the slope stability calculus are displayed in this window.
The window is made up by two separated areas. The upper part is the tool bar, which allows the user to interact with the window and to represent the desired results, choosing the display format of these results. Below the toolbar is the display area, in which the results and data are displayed.
Tool bar
The function of each of the buttons and controls of the tool bar is described below:
 Exit and close the window.

 Show the minimum security factor only
for each centre.
Show the minimum security factor only
for each centre.
 Left direction slip.
 Right direction slip.
 Show previous slip surface (it may be
unavailable if the show the minimum security factor only option has been
selected).
Show previous slip surface (it may be
unavailable if the show the minimum security factor only option has been
selected).
 Show next slip surface (it may be
unavailable if the show the minimum security factor only option has been
selected).
Show next slip surface (it may be
unavailable if the show the minimum security factor only option has been
selected).
 Show results of the previous centre.
 Show results of the next centre.
 Activate / deactivate the security
factor distribution.
Activate / deactivate the security
factor distribution.
 Activate / deactivate the pore water
pressure lines.
Activate / deactivate the pore water
pressure lines.
 Show the complete circles or just the
slip surface.
Show the complete circles or just the
slip surface.
 Activate / deactivate the display of
forces and pressures (in this case it is unavailable because the model has no
loads).
Activate / deactivate the display of
forces and pressures (in this case it is unavailable because the model has no
loads).
 Activate
/ deactivate the display of earth reinforcement groups.
Activate
/ deactivate the display of earth reinforcement groups.
 Export the model to a graphics file.
 List
properties and results.
List
properties and results.
 Shows the help document.
 Display the
slip surface with this Id number.
Display the
slip surface with this Id number.
 Displays
the slip surface associated to this safety factor.
Displays
the slip surface associated to this safety factor.
 Maximum
security factor displayed in the distribution.
Maximum
security factor displayed in the distribution.
 Number of colors to
be displayed.
Number of colors to
be displayed.
Display area
In this part of the window the required data and results are shown.
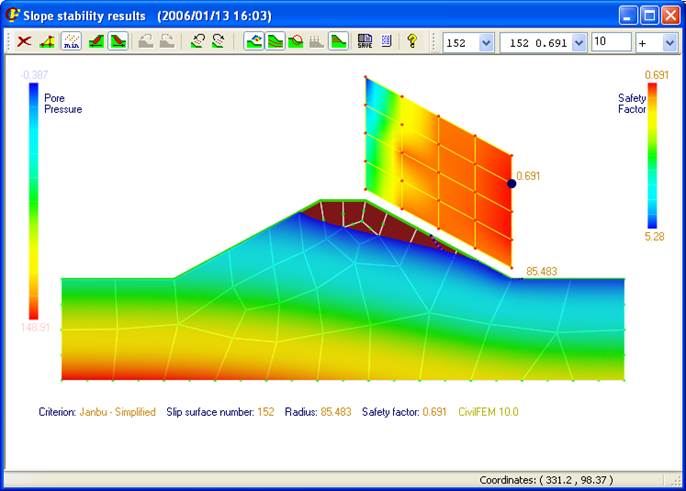
In the following illustration the displayed data are described:

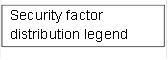
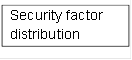

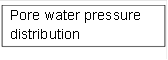





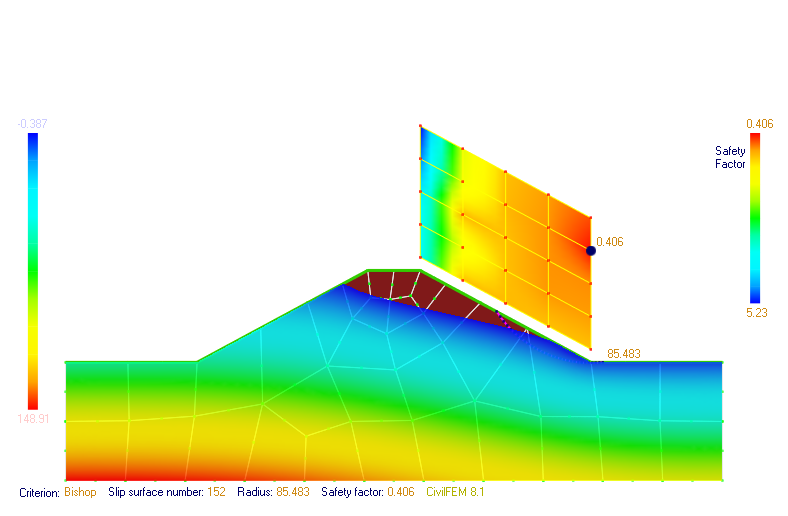
The pore water pressure distribution is only available if a free surface flow calculus is done and its result is imported (jobname.PRESS). If the seep calculus has not been done, it is possible to define the pore water pressure lines using the ~SLPPWP command. In this case the lines will be drawn, without graphical legend.
The centre of the slip surface can also be chosen by clicking on top of the security factors mesh.
Clicking with the mouse right button on any point of the display area, a menu is shown with some graphical utilities (Zoom, Fit, etc.)
Visualization Options
By
clicking on the  icon, the following menu is displayed:
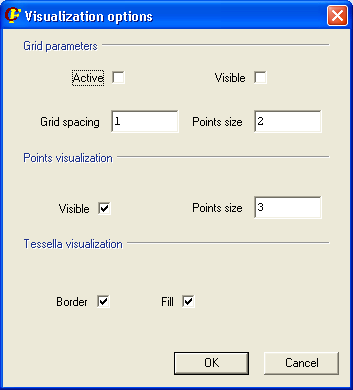
It is possible to configure the following drawing parameters:
- Grid parameters: A grid can be displayed and activated to force the mouse pointer to move from point to point of the grid. The grid spacing can be modified (its value must be specified in the active length unit), and the drawing size of the points of the grid can also be changed.
- Points visualization: The points that represent the tessella nodes can be shown or not, and its size can be changed.
- Tessella visualization: All the tessella of the model can be filled with a solid color or left transparent. Its border lines can also be activated or deactivated.
Related commands: