

Chapter 3
Materials
3.1 Introduction
Material properties considered by CivilFEM include ANSYS standard properties as well as other properties necessary for CivilFEM specific calculations, such as properties related to codes: characteristic strengths, yield strengths, reduction coefficients, etc.
When defining a material within CivilFEM, ANSYS standard properties are automatically defined; ANSYS materials will be assigned the same numbering as the CivilFEM materials. Thus, it is not recommended to directly modify ANSYS' material properties, to avoid unexpected behaviors between ANSYS and CivilFEM databases.
CivilFEM materials have five different kinds of properties:
|
General properties |
: |
Common properties for all kinds of materials |
|
Material properties |
: |
Reserved for steel, concrete, etc. |
|
Code properties |
: |
Related to Eurocode 2, Eurocode 3, ACI, CEB-FIP, etc. |
|
Active properties |
: |
Obtained for the actual active time |
|
FLAC3D properties |
: |
Properties to be applied when exporting the model to FLAC3D |
General properties are common to all categories of CivilFEM materials and contain data identifying the materials (number, reference, type…); mechanical properties, costs and the activation times of each material are transferred to ANSYS materials.
Specific material properties are always available for a particular material, regardless of the code under which the material was defined.
Specific code properties contain particular material data for each code.
Active material properties depend on the age of the material and are calculated for the active time (see section 3.6 for more information).
FLAC3D properties are divided in two groups:
|
Soils (type 5) Rocks (type 6) |
|
Structural steel (type 1) Concrete (type 2) Reinforcing steel (type 3) Prestressing steel (type 4) |
These properties will be used to define the constitutive models and the structural element properties in the exporting process to FLAC3D.
CivilFEM material definition (see ~CFMP command) is achieved by selecting one of the materials from the library. The following types of materials can be defined in the current version:
· Structural steels
· Concretes
· Reinforcing steels
· Prestressing steels
· Soils
· Rocks
Once the material is defined, the material is labeled with a reference which relates it to the chosen library material. The user can modify those properties which are not associated with the library. In order to modify the data associated with a library reference, the material must be labeled “User Def”.
The following labels characterize the type of datum regarding the possibility of changes made by the user:
|
LIBR: |
Data associated to a library reference. In order to modify a property with this label, the material should first become “User Def”. |
|
LOCK: |
Blocked data. Data cannot be modified by the user. |
|
MODF: |
Data may be modified by the user. |
Additionally, there are several dependent parameters in a material’s data which are automatically updated. Therefore, the user must account for these values when modifying those related properties (see chapter 3.7 for further details).
3.2 General Properties
General properties are those properties common to all kinds of materials (concrete, structural steel and reinforcing steel). These properties have labels and values described hereafter:
|
Umat |
Material number defined by the user. |
||||||||||||||||||||||||||||||||||||||||||||||||||||||||||||||||||||||||||||||||||||||||
|
Ref8 |
Reference. |
||||||||||||||||||||||||||||||||||||||||||||||||||||||||||||||||||||||||||||||||||||||||
|
Name |
User material name. |
||||||||||||||||||||||||||||||||||||||||||||||||||||||||||||||||||||||||||||||||||||||||
|
Type |
Material type.
|
||||||||||||||||||||||||||||||||||||||||||||||||||||||||||||||||||||||||||||||||||||||||
|
TAct |
Material activation time |
||||||||||||||||||||||||||||||||||||||||||||||||||||||||||||||||||||||||||||||||||||||||
|
TDeact |
Material deactivation time |
||||||||||||||||||||||||||||||||||||||||||||||||||||||||||||||||||||||||||||||||||||||||
|
Ex |
Modulus of elasticity of the material.
|
||||||||||||||||||||||||||||||||||||||||||||||||||||||||||||||||||||||||||||||||||||||||
|
NUxy |
Poisson's modulus. Depends on the active code and the material type (0£ Nuxy < 0.5).
|
||||||||||||||||||||||||||||||||||||||||||||||||||||||||||||||||||||||||||||||||||||||||
|
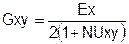
Gxy |
Shear modulus. It is calculated using the following formula:
|
||||||||||||||||||||||||||||||||||||||||||||||||||||||||||||||||||||||||||||||||||||||||
|
ALP |
Coefficient of linear thermal expansion. Its initial value depends on the active code:
|
||||||||||||||||||||||||||||||||||||||||||||||||||||||||||||||||||||||||||||||||||||||||
|
RHO |
Density value of the material. RHO = GAM/g
|
||||||||||||||||||||||||||||||||||||||||||||||||||||||||||||||||||||||||||||||||||||||||
|
GAM |
Specific weight of the material. GAM = RHO*g
|
||||||||||||||||||||||||||||||||||||||||||||||||||||||||||||||||||||||||||||||||||||||||
|
DAMP |
Damping of the material. For transient analyses: K matrix multiplier (b) for damping. For spectral analyses: critical damping ratio. |
||||||||||||||||||||||||||||||||||||||||||||||||||||||||||||||||||||||||||||||||||||||||
|
VCost |
Cost per volume unit. Vcost = Mcost*RHO = Wcost*GAM |
||||||||||||||||||||||||||||||||||||||||||||||||||||||||||||||||||||||||||||||||||||||||
|
MCost |
Cost per mass unit. Mcost = Vcost/RHO = Wcost*g |
||||||||||||||||||||||||||||||||||||||||||||||||||||||||||||||||||||||||||||||||||||||||
|
WCost |
Cost per weight unit. Wcost = Vcost/GAM = Mcost/g |
||||||||||||||||||||||||||||||||||||||||||||||||||||||||||||||||||||||||||||||||||||||||
3.3 Specific Material Properties
3.3.1 Structural Steel
Command ~CFMP, defines all material properties for structural steel, including those properties that are necessary to carry out an ANSYS analysis. Specific structural steel material properties supported by CivilFEM are described hereafter:
3.3.1.1 Thickness Table and Dependent Properties
|
NThk |
Refers to the range number for the different material's thickness. NThk £ 6 |
||||||||||||||||||||
|
Thik |
Thickness table. Thik ³ 0 |
||||||||||||||||||||
|
ExLn |
Modulus of elasticity for linear analysis. ExLn ³ 0. The initial value depends on the active code:
|
3.3.1.2 Plastic Behavior in ANSYS
|
KPLA |
Refers to the type of behavior.
|
||||||||||||
|
PLRAT |
Elastic/Plastic modulus ratio. This ratio is by default equal to 10000. PLRAT ³ 0 |
||||||||||||
|
PLThk |
Thickness used to define the plastic behavior. PLThk ³ 0 |
3.3.1.3 Stress Strain Diagram for Structural Analysis
|
TSASSD |
Type of stress-strain diagram. Each different type of stress-strain diagrams available depends on the code for which the material was defined. Apart from available diagrams supported by the codes, it is possible to define new diagrams by selecting the “User defined” option. |
|
NPSASSD |
Number of diagram points. |
|
SAEPS |
Strain values corresponding to a point of the diagram. |
|
SASGM |
Stress values corresponding to a point of the diagram. |
3.3.1.3.1 Stress-strain diagrams conforming to Eurocode 3
The available stress-strain diagrams for Eurocode 3 are:
|
TSASSD= 0 |
User defined |
|
TSASSD= 1 |
Elastic |
|
TSASSD= 2 |
Bilinear |
Definition of the elastic diagram (TSASSD = 1):
The sign criterion for the definition of stress-strain diagram points is as follows:
+Tension, -Compression
A total of 2 points (NPSASSD = 2) has been selected for the definition of the stress-strain diagram. Strain values are the following:
|
SAEPS (1) = |
-1.0E-2 |
|
SAEPS (2) = |
1.0E-2 |
Stress values are the following:
|
SASGM (1) = |
SAEPS(1)*ExLn |
|
SASGM (2) = |
SAEPS(2)*ExLn |
Definition of the bilinear diagram (TSASSD = 2):
The sign criterion for the definition of stress-strain diagram points is as follows:
+Tension, -Compression
A total of 4 points (NPSASSD = 4) has been selected for the definition of the stress-strain diagram. The strain values conform to article Art. 5.2.1.4 and are the following:
|
SAEPS (1) = |
-1.0E-2 |
|
SAEPS (2) = |
-fy / ExLn |
|
SAEPS (3) = |
fy / ExLn |
|
SAEPS (4) = |
1.0E-2 |
Stress values also conform to article Art. 5.2.1.4 and are the following:
|
SASGM (1) = |
-fy+(SAEPS (1) - SAEPS (2)) / PLRAT*ExLn |
|
SASGM (2) = |
-fy |
|
SASGM (3) = |
fy |
|
SASGM (4) = |
fy + (SAEPS (4) - SAEPS (3)) / PLRAT*ExLn |
3.3.1.3.2 Stress-strain diagrams conforming to the Spanish EA code
The different stress-strain diagrams according to EA code are:
|
TSASSD= 0 |
User defined |
|
TSASSD= 1 |
Elastic |
|
TSASSD= 2 |
Bilinear |
Definition of the elastic diagram (TSASSD = 1):
The sign criterion for the definition of stress-strain diagram points is as follows:
+Tension, -Compression
A total of 2 points (NPSASSD = 2) has been selected for the definition of the stress-strain diagram. Strain values are the following:
|
SAEPS (1) = |
-1.0E-2 |
|
SAEPS (2) = |
1.0E-2 |
Stress values are the following:
|
SASGM (1) = |
SAEPS(1)*ExLn |
|
SASGM (2) = |
SAEPS(2)*ExLn |
Definition of the bilinear diagram (TSASSD = 2):
The sign criterion for the definition of stress-strain diagram points is as follows:
+Tension, -Compression
A total of 4 points (NPSASSD = 4) has been selected for the definition of the stress-strain diagram. Strain values are the following:
|
SAEPS (1) = |
-1.0E-2 |
|
SAEPS (2) = |
-SIGe / ExLn |
|
SAEPS (3) = |
SIGe / ExLn |
|
SAEPS (4) = |
1.0E-2 |
Stress values are the following:
|
SASGM (1) = |
- SIGe +(SAEPS (1) - SAEPS (2)) / PLRAT*ExLn |
|
SASGM (2) = |
- SIGe |
|
SASGM (3) = |
SIGe |
|
SASGM (4) = |
SIGe + (SAEPS (4) - SAEPS (3)) / PLRAT*ExLn |
3.3.1.3.3 Stress-strain diagrams conforming to LRFD
The available stress-strain diagrams for LRFD are:
|
TSASSD= 0 |
User defined |
|
TSASSD= 1 |
Elastic |
|
TSASSD= 2 |
Bilinear |
Definition of the elastic diagram (TSASSD = 1):
The sign criterion for the definition of stress-strain diagram points is as follows:
+Tension, -Compression
A total of 2 points (NPSASSD = 2) has been selected for the definition of the stress-strain diagram. Strain values are the following:
|
SAEPS (1) = |
-1.0E-2 |
|
SAEPS (2) = |
1.0E-2 |
Stress values are the following:
|
SASGM (1) = |
SAEPS(1)*ExLn |
|
SASGM (2) = |
SAEPS(2)*ExLn |
Definition of the bilinear diagram (TSASSD = 2):
The sign criterion for the definition of stress-strain diagram points is as follows:
+Tension, -Compression
A total of 4 points (NPSASSD = 4) has been selected for the definition of the stress-strain diagram. Strain values are the following:
|
SAEPS (1) = |
-1.0E-2 |
|
SAEPS (2) = |
-fy / ExLn |
|
SAEPS (3) = |
fy / ExLn |
|
SAEPS (4) = |
1.0E-2 |
Stress values are the following:
|
SASGM (1) = |
-fy+(SAEPS (1) - SAEPS (2)) / PLRAT*ExLn |
|
SASGM (2) = |
-fy |
|
SASGM (3) = |
fy |
|
SASGM (4) = |
fy + (SAEPS (4) - SAEPS (3)) / PLRAT*ExLn |
3.3.1.3.4 Stress-strain diagrams conforming to BS 5950
The available stress-strain diagrams for BS 5950 are:
|
TSASSD= 0 |
User defined |
|
TSASSD= 1 |
Elastic |
|
TSASSD= 2 |
Bilinear |
Definition of the elastic diagram (TSASSD = 1):
The sign criterion for the definition of stress-strain diagram points is as follows:
+Tension, -Compression
A total of 2 points (NPSASSD = 2) has been selected for the definition of the stress-strain diagram. Strain values are the following:
|
SAEPS (1) = |
-1.0E-2 |
|
SAEPS (2) = |
1.0E-2 |
Stress values are the following:
|
SASGM (1) = |
SAEPS(1)*ExLn |
|
SASGM (2) = |
SAEPS(2)*ExLn |
Definition of the bilinear diagram (TSASSD = 2):
The sign criterion for the definition of stress-strain diagram points is as follows:
+Tension, -Compression
A total of 4 points (NPSASSD = 4) has been selected for the definition of the stress-strain diagram. Strain values are the following:
|
SAEPS (1) = |
-1.0E-2 |
|
SAEPS (2) = |
-fy / ExLn |
|
SAEPS (3) = |
fy / ExLn |
|
SAEPS (4) = |
1.0E-2 |
Stress values are the following:
|
SASGM (1) = |
-fy+(SAEPS (1) - SAEPS (2)) / PLRAT*ExLn |
|
SASGM (2) = |
-fy |
|
SASGM (3) = |
Fy |
|
SASGM (4) = |
fy + (SAEPS (4) - SAEPS (3)) / PLRAT*ExLn |
3.3.1.3.5 Stress-strain diagrams conforming to GB50017
The available stress-strain diagrams for GB50017 are:
|
TSASSD= 0 |
User defined |
|
TSASSD= 1 |
Elastic |
|
TSASSD= 2 |
Bilinear |
Definition of the elastic diagram (TSASSD = 1):
The sign criterion for the definition of stress-strain diagram points is as follows:
+Tension, -Compression
A total of 2 points (NPSASSD = 2) has been selected for the definition of the stress-strain diagram. Strain values are the following:
|
SAEPS (1) = |
-1.0E-2 |
|
SAEPS (2) = |
1.0E-2 |
Stress values are the following:
|
SASGM (1) = |
SAEPS(1)*ExLn |
|
SASGM (2) = |
SAEPS(2)*ExLn |
Definition of the bilinear diagram (TSASSD = 2):
The sign criterion for the definition of stress-strain diagram points is as follows:
+Tension, -Compression
A total of 4 points (NPSASSD = 4) has been selected for the definition of the stress-strain diagram. Strain values are the following:
|
SAEPS (1) = |
-1.0E-2 |
|
SAEPS (2) = |
-fy / ExLn |
|
SAEPS (3) = |
fy / ExLn |
|
SAEPS (4) = |
1.0E-2 |
Stress values are the following:
|
SASGM (1) = |
-fy+(SAEPS (1) - SAEPS (2)) / PLRAT*ExLn |
|
SASGM (2) = |
-fy |
|
SASGM (3) = |
Fy |
|
SASGM (4) = |
fy + (SAEPS (4) - SAEPS (3)) / PLRAT*ExLn |
3.3.1.4 Stress-Strain Diagram for Section Analysis
|
SDEPS |
Strain values corresponding to a point of the diagram. |
|
SDSGM |
Stress values corresponding to a point of the diagram. |
|
TSDSSD |
Type of stress-strain diagram. The different type of stress-strain diagrams available depend on the code for which the material was defined. Apart from available diagrams supported by codes, it is possible to define new ones by selecting the “User defined” option. |
|
NPSDSSD |
Number of diagram points. |
3.3.1.4.1 Stress-strain diagrams conforming to Eurocode 3
The different types of stress-strain diagrams available according to Eurocode 3 are:
|
TSDSSD= 0 |
User defined |
|
TSDSSD= 1 |
Bilinear |
Definition of the bilinear diagram (TSDSSD = 1):
The sign criterion for the definition of stress-strain diagram points is as follows:
+Tension, -Compression
A total of 4 points (NPSDSSD = 4) has been selected for the definition of the stress-strain diagram. Strain values conform to article Art. 5.2.1.4 and are the following:
|
SDEPS (1) = |
-1.0E-2 |
|
SDEPS (2) = |
-fy / ExLn / GAMM0 |
|
SDEPS (3) = |
fy / ExLn / GAMM0 |
|
SDEPS (4) = |
1.0E-2 |
Stress values are the following:
|
SDSGM (1) = |
(-fy+(SDEPS (1) - SDEPS (2)) / PLRAT*ExLn) / GAMM0 |
|
SDSGM (2) = |
-fy / GAMM0 |
|
SDSGM (3) = |
fy / GAMM0 |
|
SDSGM (4) = |
(fy + (SDEPS (4) - SDEPS (3)) / PLRAT*ExLn) / GAMM0 |
3.3.1.4.2 Stress-strain diagrams conforming to the Spanish EA code
The different stress-strain diagrams according to the EA code are:
|
TSDSSD= 0 |
User defined |
|
TSDSSD= 1 |
Bilinear |
Definition of the bilinear diagram (TSDSSD = 1)
The sign criterion for the definition of stress-strain diagram points is as follows:
+Tension, -Compression
A total of 4 points (NPSDSSD = 4) has been chosen for the definition of the stress-strain diagram. Strain values are the following:
|
SDEPS (1) = |
-1.0E-2 |
|
SDEPS (2) = |
-SIGe / ExLn / GAMa |
|
SDEPS (3) = |
SIGe / ExLn / GAMa |
|
SDEPS (4) = |
1.0E-2 |
Stress values are the following:
|
SDSGM (1) = |
(- SIGe +(SDEPS (1) - SDEPS (2)) / PLRAT*ExLn) / GAMa |
|
SDSGM (2) = |
- SIGe / GAMa |
|
SDSGM (3) = |
SIGe / GAMa |
|
SDSGM (4) = |
(SIGe + (SDEPS (4) - SDEPS (3)) / PLRAT*ExLn) / GAMa |
3.3.1.4.3 Stress-strain diagrams conforming to the LRFD code
The different stress-strain diagrams according to LRFD code are:
|
TSDSSD= 0 |
User defined |
|
TSDSSD= 1 |
Bilinear |
Definition of the bilinear diagram (TSDSSD = 1)
The sign criterion for the definition of stress-strain diagram points is as followings:
+Tension, -Compression
A total of 4 points (NPSDSSD = 4) has been selected for the definition of the stress-strain diagram. Strain values are the following:
|
SDEPS (1) = |
-1.0E-2 |
|
SDEPS (2) = |
-fy / ExLn |
|
SDEPS (3) = |
fy / ExLn |
|
SDEPS (4) = |
1.0E-2 |
Stress values are the following:
|
SDSGM (1) = |
(-fy+(SDEPS (1) - SDEPS (2)) / PLRAT*ExLn) |
|
SDSGM (2) = |
-fy |
|
SDSGM (3) = |
fy |
|
SDSGM (4) = |
(fy + (SDEPS (4) - SDEPS (3)) / PLRAT*ExLn) |
3.3.1.4.4 Stress-strain diagrams conforming to the BS5950 code
The different stress-strain diagrams according to the BS5950 code are:
|
TSDSSD= 0 |
User defined |
|
TSDSSD= 1 |
Bilinear |
Definition of the bilinear diagram (TSDSSD = 1)
The sign criterion for the definition of stress-strain diagram points is as follows:
+Tension, -Compression
A total of 4 points (NPSDSSD = 4) has been selected for the definition of the stress-strain diagram. Strain values are the following:
|
SDEPS (1) = |
-1.0E-2 |
|
SDEPS (2) = |
-ROy / ExLn |
|
SDEPS (3) = |
ROy / ExLn |
|
SDEPS (4) = |
1.0E-2 |
Stress values are the following:
|
SDSGM (1) = |
(-fy+(SDEPS (1) - SDEPS (2)) / PLRAT*ExLn) |
|
SDSGM (2) = |
-ROy |
|
SDSGM (3) = |
Roy |
|
SDSGM (4) = |
(fy + (SDEPS (4) - SDEPS (3)) / PLRAT*ExLn) |
3.3.1.4.5 Stress-strain diagrams conforming to the GB50017 code
The different stress-strain diagrams according to the GB50017 code are:
|
TSDSSD= 0 |
User defined |
|
TSDSSD= 1 |
Bilinear |
Definition of the bilinear diagram (TSDSSD = 1)
The sign criterion for the definition of stress-strain diagram points is as follows:
+Tension, -Compression
A total of 4 points (NPSDSSD = 4) has been selected for the definition of the stress-strain diagram. Strain values are the following:
|
SDEPS (1) = |
-1.0E-2 |
|
SDEPS (2) = |
-f / ExLn |
|
SDEPS (3) = |
f / ExLn |
|
SDEPS (4) = |
1.0E-2 |
Stress values are the following:
|
SDSGM (1) = |
-f+(SDEPS (1) - SDEPS (2)) / PLRAT*ExLn) |
|
SDSGM (2) = |
-f |
|
SDSGM (3) = |
F |
|
SDSGM (4) = |
f + (SDEPS (4) - SDEPS (3)) / PLRAT*ExLn) |
3.3.1.5 Strain Limits for Steel-Concrete Composite Sections Design
|
EPSmax |
Maximum permisible strain in tension at any point of the section (Point A in the pivot diagram). Sign criterion: + Tension, - Compression EPSmax = 0.010 (default value) If EPSmax = 0, there is no limit |
|
EPSmin |
Maximum permisible strain in compression at any point of the section (Point B in the pivot diagram). Sign criterion: + Tension, - Compression EPSmin = -0.010 (default value) If EPSmin = 0, there is no limit |
3.3.2 Concrete
Command ~CFMP defines all concrete material properties including those properties required for an ANSYS analysis.
Note: CivilFEM does not contain the material data conforming to the Australian Standard AS3600. If this code is activated, the selected material (concrete or reinforcement steel) will be filled out with the same parameters as the ACI-318 code requires.
Specific concrete material properties supported by CivilFEM are described hereafter:
3.3.2.1 Time Dependent Properties
|
NAge |
Number of material age points defined. This value must be between 0 and 50. A different stress-strain diagram is defined for each of the age points defined. |
|
Age(NAge) |
Age tables, in days (Age ³ 0). |
|
MatAge |
Material age, calculated using the following equation: MatAge = ActTime - TmAct |
The initial values of NAge and Age depend on the active code under which the material is defined:
Eurocode 2 and ITER:
|
NAge = |
20 |
|
Age = |
1, 3, 7, 10, 14, 21, 28, 40, 60, 75, 90, 120, 200, 365, 600, 1000, 1800, 3000, 6000, 10000 days |
ACI-318, ACI 349-01, ACI 359-04, AASHTO, AS 3600:
|
NAge = |
20 |
|
Age = |
1, 3, 7, 10, 14, 21, 28, 40, 60, 75, 90, 120, 200, 365, 600, 1000, 1800, 3000, 6000, 10000 days |
EHE:
|
NAge = |
20 |
|
Age = |
1, 3, 7, 10, 14, 21, 28, 40, 60, 75, 90, 120, 200, 365, 600, 1000, 1800, 3000, 6000, 10000 days |
CEB-FIP:
|
NAge = |
20 |
|
Age = |
1, 3, 7, 10, 14, 21, 28, 40, 60, 75, 90, 120, 200, 365, 600, 1000, 1800, 3000, 6000, 10000 days |
BS8110:
|
NAge = |
20 |
|
Age = |
1, 3, 7, 10, 14, 21, 28, 40, 60, 75, 90, 120, 200, 365, 600, 1000, 1800, 3000, 6000, 10000 days |
GB50010:
|
NAge = |
20 |
|
Age = |
1, 3, 7, 10, 14, 21, 28, 40, 60, 75, 90, 120, 200, 365, 600, 1000, 1800, 3000, 6000, 10000 days |
NBR6118:
|
NAge = |
20 |
|
Age = |
1, 3, 7, 10, 14, 21, 28, 40, 60, 75, 90, 120, 200, 365, 600, 1000, 1800, 3000, 6000, 10000 days |
IS456:
|
NAge = |
20 |
|
Age = |
1, 3, 7, 10, 14, 21, 28, 40, 60, 75, 90, 120, 200, 365, 600, 1000, 1800, 3000, 6000, 10000 days |
SP52101,SP63133:
|
NAge = |
20 |
|
Age = |
1, 3, 7, 10, 14, 21, 28, 40, 60, 75, 90, 120, 200, 365, 600, 1000, 1800, 3000, 6000, 10000 days |
3.3.2.2 Linear Structural Analysis Properties
|
TpEx |
Type of elastic modulus used. The different types, admited by CivilFEM are the following:
|
||||||||||||||||||||||||||||||||||||||||||||||||||
|
ExLn |
Modulus of elasticity for linear analysis. The different options for the elastic modulus will vary depending on the active code. These are the types of modulus available for each one of the codes:
|
3.3.2.3 Strain Limits for Section's Design
|
EPSmin |
Maximum admissible strain in compression at any point of the section (Point B of the pivots diagram). Sign criterion: + Tension, - Compression |
|
|
Eurocode 2 |
|
|
EPSmin = -0.0035 If concrete has fck > 50 MPa, the concrete strain limit is: EPSmin = -(2.6+35[(90-fck)/100]4) · 10-3 (with fck in MPa). |
|
|
ACI |
|
|
EPSmin = -0.0030 |
|
|
CEB-FIP |
|
|
For this code, the maximum admissible strains depend on the selected stress-strain diagram. The initial values taken as the Maximum admissible strain in compression at any point of the section are the following: If TSDSSD = 0 then EPSmin = -0.0035 If TSDSSD = 1 then EPSmin = -EPScuB If TSDSSD = 2 then EPSmin = -EPScuU |
|
|
EHE |
|
|
EPSmin = -0.0035 If concrete has fck > 50 MPa, the concrete strain limit is: EPSmin = -(2.6+14.4[(100-fck)/100]4) · 10-3 (with fck in MPa). |
|
|
BS8110 |
|
|
EPSmin = -0.0035 |
|
|
GB50010 |
|
|
EPSmin = - EPScu |
|
|
NBR6118 |
|
|
EPSmin = -0.0035 |
|
|
IS456 |
|
|
EPSmin = -0.0035 |
|
|
SP52101,SP63133 |
|
|
EPSmin = EPSb2 |
|
EPSint |
Maximum permisible strain in compression at interior points of the section (Point C of the pivot diagram). Sign criterion:+ Tension, - Compression |
|
|
Eurocode 2 |
|
|
EPSint = -0.0020 If concrete has fck > 50 MPa, the concrete strain limit is: EPSint = -(2.0+0.085(fck-50)0.53) · 10-3 (with fck in MPa). |
|
|
ACI |
|
|
EPSint = 0 (there is no limit). |
|
|
CEB-FIP |
|
|
For this code, the maximum admissible strains depend on the selected stress-strain diagram. The initial values taken as the Maximum admissible strain in compression at any point of the section are the following: If TSDSSD = 0 then EPSmin = -0.0020 If TSDSSD = 1 then EPSmin = -EPScuC If TSDSSD = 2 then EPSmin = 0 (there is no limit). |
|
|
EHE |
|
|
EPSint = -0.0020 If concrete has fck > 50 MPa, the concrete strain limit will then be: EPSint = -(2.0+0.085(fck-50)0.5) · 10-3 (with fck in MPa). |
|
|
BS8110 |
|
|
EPSint = 0 (there is no limit). |
|
|
GB50010 |
|
|
EPSint = EPS0 |
|
|
NBR6118 |
|
|
EPSint = -0.0020 |
|
|
IS456 |
|
|
EPSint = -0.0020 |
|
|
SP52101, SP63133 |
|
|
EPSint = EPSb0 |
|
PCLevel |
This value refers to the vertical distance in the section between the most compressed fiber and Point C of the pivot diagram. |
|
|
PCLevel = 3/7 |
3.3.2.4 Shrinkage and Creep
|
NApt |
Number of load application ages defined. |
||||||||||
|
Apt(NApt) |
Load application age tables, in days (Apt ³ 0). |
||||||||||
|
KCREEP |
Creep method
|
||||||||||
|
KSHRINK |
Shrinkage method.
|
||||||||||
|
AGECOEFF |
Aging coefficient (by default 0.8). |
||||||||||
|
CREEPCF (NAge,NApt) |
Creep coefficient. |
||||||||||
|
EPSSHRNK (NAge) |
Shrinkage strain |
||||||||||
|
KCRCOD |
Calculation method selected for the definition of shrinkage strains and creep coefficients curves.
|
Each calculation method has its own parameters:
|
EC2: |
|
|
RH |
Relative humidity (%). Default value = 60%. |
|
H |
Fictitious thickness in millimeters. Default value = 600mm. |
|
CEB: |
|
|
RH |
Relative humidity (%). Default value = 60%. |
|
H |
Fictitious thickness in millimeters. Default value = 600mm. |
|
EHE: |
|
|
RH |
Relative humidity (%). Default value = 60%. |
|
H |
Fictitious thickness in millimeters. Default value = 600mm. |
|
ACI: |
|
|
PSI |
Creep factor. Default value = 0.60. |
|
D |
Creep age (days). Default value = 10 days. |
|
NUU |
Ultimate (in time) creep coefficient. Default value = 2.35. |
|
ALPHA |
Shrinkage factor. Default value = 1.0. |
|
F |
Shrinkage age. Default value = 55 days. |
|
EPSSLU |
Ultimate (in time) shrinkage strain. Def. value = -780·10-6. |
3.3.3 Reinforcement Steel
The ~CFMP command defines all reinforcement steel material properties including those properties that are necessary to carry out an ANSYS analysis. Specific reinforcement steel material properties supported by CivilFEM are described hereafter:
3.3.3.1 Strain Limits for Concrete Sections Check and Design
|
EPSmax |
Refers to the maximum admissible strain in tension at any point of the section (Point A in the pivot diagram). Sign criterion: + Tension, - Compression The initial value depends on the active code: |
|
|
Eurocode 2 |
|
|
EPSmax = 0.010 (Art. 4.3.1.2 and Art. 4.2.2.3.2) |
|
|
ACI |
|
|
EPSmax = 0 (there is no limit). |
|
|
CEB-FIP |
|
|
EPSmax = 0.010 |
|
|
EHE |
|
|
EPSmax = 0.010 |
|
|
BS8110 |
|
|
EPSmax = 0 |
|
|
GB50010 |
|
|
EPSmax = 0.010 |
|
|
NBR6118 |
|
|
EPSmax = 0.010 |
|
|
IS456 |
|
|
EPSmax = 0 |
|
|
SP52101,SP63133 |
|
|
EPSmax = 0.025 |
3.3.4 Prestressing Steel
The ~CFMP command defines all the prestressing steel material properties, including those properties that are necessary to perform an ANSYS analysis. Specific prestressing steel material properties supported by CivilFEM are described hereafter:
3.3.4.1 Data for Calculating Prestressing Losses
|
MU |
Friction coefficient between the tendons and their casing (by default MU=0.20) |
|
K |
Unintentional angular displacement per unit lenght (by default K= 0.01m-1) |
|
A |
Anchorage slip (by default a= 0.006m) |
|
EPSsr |
Concrete skrinkage strain (by default = 0.0004) |
|
PHI |
Concrete creep strain (by default = 2.00) |
3.3.4.2 Strain Limits for Concrete Sections Check and Design
|
EPSmax |
Indicates the maximum admissible strain in tension at any point of the section (Point A of the pivot diagram). Sign criterion: + Tension, - Compression EPSmax³0, if EPSmax=0, there is no limit The initial value depends on the active code: |
|
|
Eurocode 2 |
|
|
EPSmax = 0.010 |
|
|
EHE |
|
|
EPSmax = 0.010 |
|
|
ACI |
|
|
EPSmax = 0.00 |
3.3.5 Soils
The ~CFMP command defines all soil material properties including the properties necessary to carry out an ANSYS analysis. Specific soil material properties supported by CivilFEM are described hereafter:
|
TpEx |
Type of elasticity modulus used in structural analysis:
|
||||||
|
ExCal |
Elasticity modulus used in structural analysis: |
||||||
|
TpNUxy |
Type of Poisson coefficient used in structural analysis:
|
||||||
|
NUxycal |
Poisson coefficient used in structural analysis: |
||||||
|
TpRHO |
Type of density used in structural analysis:
|
||||||
|
RHOcal |
Density used in structural analysis: |
||||||
|
KPLA |
Behavior type:
|
||||||
|
ExSt |
Static elasticity modulus |
||||||
|
NUxySt |
Static Poisson modulus |
||||||
|
Vp |
P waves velocity |
||||||
|
Vs (MODF) |
S waves velocity |
||||||
|
Exd |
Dynamic elasticity modulus |
||||||
|
NUxyd |
Dynamic Poisson modulus |
||||||
|
GAMd |
Dry specific weight |
||||||
|
GAMs |
Solid specific weight: GAMs = GAMd/(1-n) |
||||||
|
GAMsat |
Saturated specific weight: GAMsat = (GAMs + GAMw*e) / (1+e) = GAMs*(1-n)+ GAMw*n |
||||||
|
GAMsub |
Submerged specific weight: GAMsub = GAMsat - GAMw |
||||||
|
GAMap |
Apparent specific weight: GAMap = GAMd*(1+W) |
||||||
|
GAMw |
Water specific weight |
||||||
|
RHOd |
Dry density RHOd = GAMd/g |
||||||
|
RHOs |
Solid density RHOs = GAMs/g |
||||||
|
RHOsat |
Saturated density RHOsat = GAMsat/g |
||||||
|
RHOsub |
Submerged density RHOsub = GAMsub/g |
||||||
|
RHOap |
Apparent density RHOap = GAMap/g |
||||||
|
RHOrel |
Relative density (by default 0.5) |
||||||
|
n |
Porosity (1 > n ≥ 0) |
||||||
|
e |
Void ratio e = n/(1-n) |
||||||
|
W |
Moisture content. |
||||||
|
Sw |
Saturation degree Sw = W*GAMs / (e*GAMw) = W*GAMd / (n*GAMw) |
||||||
|
D10 |
Diameter that allows more than 10% of material to pass through (In millimeters). |
||||||
|
D30 |
Diameter that allows more than 30% of material to pass through (In millimeters). |
||||||
|
D60 |
Diameter that allows more than 60% of material to pass through (In millimeters). |
||||||
|
Ccurv |
Curvature coefficient Ccurv = D302/(D60*D10) |
||||||
|
Cunif |
Uniformity coefficient Cunif = D60/D10 |
||||||
|
SPT |
Standard penetration test. SPT ≥ 0 |
||||||
|
CPT |
Cone penetration test. CPT ≥ 0 |
||||||
|
qu |
Resistance to simple compression. qu ≥ 0 |
||||||
|
Em |
Oedometric modulus. Em ≥ 0 |
||||||
|
qa |
Maximum admissible load. |
||||||
|
wl |
Liquid limit percentage |
||||||
|
wp |
Plastic limit percentage |
||||||
|
Ip |
Plasticity index [%]: Ip = wl - wp |
||||||
|
PHIMCeff |
Angle of effective internal friction for Mohr-Coulomb (in degrees). 90º > PHIMCeff ≥ 0º |
||||||
|
cMCeff |
Effective Cohesion. ceff ≥ 0 |
||||||
|
PHIDPeff |
Angle of effective internal friction for Drucker-Prager. 90º > PHIDPeff ≥ 0º |
||||||
|
cDPeff |
Effective Cohesion for Drucker-Prager. cDPeff ≥ 0 |
||||||
|
DELeff |
Angle of dilation. 90º > DELeff ≥ 0º |
||||||
|
K0 |
Earth pressure coefficient at rest. K0 ≥ 0 |
||||||
|
Ka |
Active earth pressure coefficient. Ka ≥ 0 |
||||||
|
Kp |
Passive earth pressure coefficient. Kp ≥ 0 |
||||||
|
Kac |
Cohesion complementary component of active earth pressure. Kac ≥ 0 |
||||||
|
Kpc |
Cohesion complementary component of passive earth pressure. Kpc ≥ 0 |
||||||
|
RuSI |
Susceptibility to pore pressure:
|
||||||
|
Ru |
Coefficient for pore pressure after consolidation. |
||||||
|
kx |
X Permeability. Kx ≥ 0 |
||||||
|
ky |
Y Permeability. Ky ≥ 0 |
||||||
|
kz |
Z Permeability. Kz ≥ 0 |
||||||
|
cv |
Consolidation coefficient. cv ≥ 0 |
||||||
|
A |
Skempton law's coefficient. A ≥ 0 |
||||||
|
B |
Skempton law's coefficient. 1 ≥ B ≥ 0 |
||||||
|
BET |
Skempton law's coefficient. |
3.3.6 Rocks
The ~CFMP command defines all rock material properties including those properties that are necessary to perform an ANSYS analysis. Specific rock material properties supported by CivilFEM are described hereafter:
|
RType |
Type |
||||||
|
RSubType |
Subtype |
||||||
|
RClass |
Class |
||||||
|
RockName |
Name |
||||||
|
TpEx |
Type of elasticity modulus used in structural analysis:
|
||||||
|
Excal |
Elasticity modulus used in structural analysis |
||||||
|
TpNUxy |
Type of Poisson’s ratio coefficient used in structural analysis:
|
||||||
|
NUxycal |
Poisson’s ratio used in structural analysis |
||||||
|
TpRHO |
Type of density used in structural analysis:
|
||||||
|
RHOcal |
Density used in structural analysis |
||||||
|
KPLA |
Behavior type:
|
||||||
|
ExSt |
Static elasticity modulus |
||||||
|
NUxySt |
Static Poisson modulus |
||||||
|
Vp |
P waves velocity |
||||||
|
Vs |
S waves velocity |
||||||
|
Exd |
Dynamic elasticity modulus |
||||||
|
NUxyd |
Dynamic Poisson modulus |
||||||
|
qu |
Resistance to simple compression. qu ≥ 0 |
||||||
|
GAMd |
Dry specific weight |
||||||
|
GAMs |
Solid specific weight GAMs = GAMd/(1-n) |
||||||
|
GAMsat |
Saturated specific weight GAMsat = (GAMs + GAMw*e) / (1+e) |
||||||
|
GAMsub |
Submerged specific weight GAMsub = GAMsat - GAMw |
||||||
|
GAMap |
Apparent specific weight GAMap = GAMd*(1+W) |
||||||
|
GAMw |
Water specific weight |
||||||
|
RHOd |
Dry density RHOd = GAMd/g |
||||||
|
RHOs |
Solid density RHOs = GAMs/g |
||||||
|
RHOsat |
Saturated density RHOsat = GAMsat/g |
||||||
|
RHOsub |
Submerged density RHOsub = GAMsub/g |
||||||
|
RHOap |
Apparent density RHOap = GAMap/g |
||||||
|
RHOrel |
Relative density (by default 0.5) |
||||||
|
n |
Porosity (1 > n ≥ 0) |
||||||
|
e |
Void ratio e = n/(1-n) |
||||||
|
W |
Moisture content. |
||||||
|
Sw |
Saturation degree Sw = W*GAMs / (e*GAMw) = W*GAMd / (n*GAMw) |
||||||
|
PHIeff |
Angle of internal friction angle. 90º > PHIeff ≥ 0º |
||||||
|
ceff |
Effective cohesion. ceff ≥ 0 |
||||||
|
PHIDPeff |
Angle of internal friction angle for Drucker-Prager. 90º > PHIDPeff ≥ 0º |
||||||
|
cDPeff |
Effective cohesion. cDPeff ≥ 0 |
||||||
|
DELeff |
Angle of dilation (degrees). 90º > DELeff ≥ 0º |
||||||
|
K0 |
Earth pressure coefficient at rest. K0 ≥ 0 |
||||||
|
RuSI |
Susceptibility to pore pressure:
|
||||||
|
Ru |
Coefficient for pore pressure after consolidation. |
||||||
|
kx |
Permeability. Kx ≥ 0 |
||||||
|
ky |
Permeability. Ky ≥ 0 |
||||||
|
kz |
Permeability. Kz ≥ 0 |
||||||
|
GSI |
Geological strength index. 100 ≥ GSI ≥ 0 |
||||||
|
HB_m |
Hoek & Brown coefficient m |
||||||
|
HB_s |
Hoek & Brown coefficient s |
||||||
|
HB_mr |
Hoek & Brown residual coefficient m |
||||||
|
HB_sr |
Hoek & Brown residual coefficient s |
||||||
|
HB_n |
Hoek & Brown coefficient n. 0.5 ≤ n < 0.65 |
||||||
|
HB_m0 |
Hoek & Brown coefficient m for unfractured rock. m0 ≥ 0 |
||||||
|
HB_s0 |
Hoek & Brown coefficient s for unfractured rock. s0 ≥ 1 |
||||||
|
HB_ALF |
Fragility / ductility limit coefficient. |
||||||
|
HB_md |
Factor for dilatancy calculation. By default HB_md=1 |
||||||
|
HB_bd |
Factor for dilatancy calculation. By default HB_bd=0 |
3.4 Specific Code Properties
There are some properties in CivilFEM that are code dependent. Code dependent properties are described hereafter for each of the materials supported by CivilFEM.
3.4.1 Eurocode 3 (Structural Steel)
For this type of material (Type = 1) the following properties are considered:
3.4.1.1 Partial Safety Factors
|
GAMM0 |
Partial safety factor for calculating the resistance of class 1, 2 or 3 sections (GAMM0 ³ 1) gM0=1.1 (Default value) |
|
GAMM1 |
Partial safety factor for calculating the resistance of class 4 sections and sections subjected to buckling (GAMM1 ³ 1) gM1=1.1 (Default value) |
|
GAMM2 |
Partial safety factor for calculating the resistance of net sections (GAMM2 ³1) gM2=1.25 (Default value) |
3.4.1.2 Mechanical Properties
|
fy (Thk) |
Yield strength of the material (fy ³ 0). |
|
fu (Thk) |
Ultimate strength (fu ³ 0). |
3.4.2 Spanish EA Code (Structural Steel)
For this type of material (Type = 1) the following properties are considered:
3.4.2.1 Partial Safety Factors
|
GAMa |
Partial safety factor (Art.3.1.7 GAMa ³ 1) gMa =1(Default value) |
3.4.2.2 Mechanical Properties
|
SIGe(Thk) |
Elastic limit (Art.3.1.7) SIGe ³ 0 |
|
SIGr(Thk) |
Tension resistance (Art.3.1.7) SIGr ³ 0 |
|
SIGu(Thk) |
Design resistance (Art.3.1.7) SIGu = SIGe/GAMa |
3.4.3 LRFD (Structural Steel)
For this type of material (Type = 1) the following properties are considered:
3.4.3.1 Mechanical Properties
|
fy (Thk) |
Yield strength of the material (fy ³ 0). |
|
fu (Thk) |
Ultimate strength (fu ³ 0). |
3.4.4 BS5950-1985 (Structural Steel)
For this type of material (Type = 1) the following properties are considered:
3.4.4.1 Mechanical Properties
|
Ys (Thk) |
Yield strength of the material (Ys ³ 0). |
||||||||
|
Us (Thk) |
Ultimate strength Art. 5.1.1 (Us³ 0). |
||||||||
|
ROy (Thk) |
Design resistance. BS 5950 Art 3.1.1 ROy = 1.0·Ys ≤ 0.84·Us |
||||||||
|
Ke (Thk) |
Effective area/Net area ratio Art. 3.3.3 BS 5950
|
3.4.5 BS5950-2000 (Structural Steel)
For this type of material (Type = 1) the following properties are considered:
3.4.5.1 Mechanical Properties
|
Ys (Thk) |
Yield strength of the material (Ys ³ 0). |
||||||||
|
Us (Thk) |
Ultimate strength Art. 3.1.1 (Us³ 0). |
||||||||
|
ROy (Thk) |
Design resistance. BS 5950 Art 3.1.1 ROy = 1.0·Ys ≤ 0.84·Us |
||||||||
|
Ke (Thk) |
Effective area/Net area ratio Art. 3.4.3 BS 5950
|

3.4.6 GB50017 (Structural Steel)
For this type of material (Type = 1) the following properties are considered:
3.4.6.1 Mechanical Properties
|
f (Thk) |
Tensile, compressive or bending strength. |
|
fce (Thk) |
Compressive strength when the ending section is under compressive load. |
|
fv (Thk) |
Shear strength. |
3.4.7 Eurocode 2 (Concrete)
For this type of material (Type = 2) the following properties are considered:
3.4.7.1 Type of Cement
|
CeTp |
Refers to the different types of cement used:
|
3.4.7.2 Partial Cafety Factors
|
GAMc |
Partial safety factor for concrete (GAMc ³ 1) (gc=1.5 default value). |
|
ALP |
Additional reduction factor for sustained compression (0£ALP£1). The default values are ALP = 0.85 for Eurocode 2 1991. ALP = 1.00 for Eurocode 2 2008. |
3.4.7.3 Mechanical Properties
|
fck |
Concrete characteristic 28-day compressive strength (+Compression fck ³ 0) |
||||||||
|
fcm |
Mean 28-day compressive strength (+ Compression) fcm ³ 0 fcm = fck + 8 N/mm2, in which fcm, and fck are in MPa. |
||||||||
|
fcd |
Design 28-day compressive strength (+Compression) fcd = fck/GAMc |
||||||||
|
fctm |
Mean tensile strength (+ Tension) fctm = 0.3*(fck2/3); fck £ 50 MPa fctm = 2.12*ln(1+(fcm/10)); fck > 50 MPa (fctm, fcm and fctk in MPa) |
||||||||
|
fctk_005 |
Lower characteristic tensile strength (percentile-5%) (+Tension) fctk_005 = 0.7*(fctm) |
||||||||
|
fctk_095 |
Upper characteristic tensile strength (percentile-95%) (+Tension) fctk_095 = 1.3*(fctm) |
||||||||
|
EPSc1 |
Strain value of the peak compressive strength (- Compression). The default value is: EPSc1 = -0.0022 for Eurocode 2 1991 and fck £ 50MPa EPSc1 = 0.7*fcm0.31 < 2.8 for Eurocode 2 2008 |
||||||||
|
EPScu |
Ultimate strain in compression (-Compression). |
||||||||
|
s |
Coefficient which depends on the type of cement.
|
3.4.7.4 Time Dependent Mechanical Properties
|
BETcc |
Coefficient which depends on the concrete age. BETcc = exp {s*[1-(28/Age)1/2]} (Age is expressed in days) |
|
fcm_t(Age) |
Mean compressive strength. (+ Compression) fcm_t = BETcc*fcm |
|
fck_t(Age) |
Characteristic t-day compressive strength. (+ Compression) fck_t = fcm_t - 8 (fck_t and fcm in MPa) |
|
fcd_t(Age) |
Design t-day compressive strength (+Compression) fcd_t = fck_t/GAMc |
|
Ecm(Age) |
Secant modulus of elasticity. Ecm = 9500*[(fck_t+8)1/3] (fck_t and Ecm in MPa) |
|
Ec(t) |
Tangent modulus of elasticity, Ec = 1.05*Ecm |
|
Ecd(t) |
Design modulus of elasticity, Ecd = Ecm/GAMc |
3.4.7.5 Stress-Strain Diagrams for Structural Analysis
The different types of stress-strain concrete diagrams available according to Eurocode 2 are:
|
TSASSD= 0 |
User defined |
|
TSASSD= 1 |
Elastic |
|
TSASSD= 2 |
Short-term loads |
3.4.7.5.1 Definition of the elastic stress-strain diagram (TSASSD = 1):
The sign criterion for the definition of stress-strain diagram points is as follows:
+Tension, -Compression
A total of 2 points (NPSASSD = 2) has been selected for the definition of the stress-strain diagram. Strain values are the following:
|
SAEPS (1) |
= |
-10-2 |
|
SAEPS (2) |
= |
10-2 |
For these points, stress values are the following:
|
SASGM (i) = SAEPS (i) * Ex |
3.4.7.5.2 Definition of the stress-strain diagram for short term loads (TSASSD = 2):
The sign criterion for the definition of stress-strain diagram points is as follows:
+Tension, -Compression
A total of 20 points (NPSDSSD = 20) has been chosen for the definition of the stress-strain diagram. The strain values are the following:
|
SAEPS (1) |
= |
1.000*(EPScu-EPSc1)+EPSc1 |
|
SAEPS (2) |
= |
0.793*(EPScu-EPSc1)+EPSc1 |
|
SAEPS (3) |
= |
0.617*(EPScu-EPSc1)+EPSc1 |
|
SAEPS (4) |
= |
0.468*(EPScu-EPSc1)+EPSc1 |
|
SAEPS (5) |
= |
0.342*(EPScu-EPSc1)+EPSc1 |
|
SAEPS (6) |
= |
0.234*(EPScu-EPSc1)+EPSc1 |
|
SAEPS (7) |
= |
0.143*(EPScu-EPSc1)+EPSc1 |
|
SAEPS (8) |
= |
0.066*(EPScu-EPSc1)+EPSc1 |
|
SAEPS (9) |
= |
1.000*EPSc1 |
|
SAEPS (10) |
= |
0.964*EPSc1 |
|
SAEPS (11) |
= |
0.922*EPSc1 |
|
SAEPS (12) |
= |
0.873*EPSc1 |
|
SAEPS (13) |
= |
0.816*EPSc1 |
|
SAEPS (14) |
= |
0.749*EPSc1 |
|
SAEPS (15) |
= |
0.669*EPSc1 |
|
SAEPS (16) |
= |
0.575*EPSc1 |
|
SAEPS (17) |
= |
0.465*EPSc1 |
|
SAEPS (18) |
= |
0.335*EPSc1 |
|
SAEPS (19) |
= |
1.181*EPSc1 |
|
SAEPS (20) |
= |
0.000 |
For these points, stress values are the following:
|
SASGM(i) = -[(k*Eta(i) -Eta(i) 2)/((1+(k-2)*Eta(i))]*fcm_t Where: |
|
|
K = |
1.10*Ecm*EPSc1/(-fcm_t) for Eurocode 2 1991 1.05*Ecm*EPSc1/(-fcm_t) for Eurocode 2 2008 |
|
Eta(i) = |
SAEPS(i) / EPSc1 |
3.4.7.6 Stress-Strain Diagrams for Section Analysis
The different types of stress-strain diagrams available for concrete, according to Eurocode 2 are the following:
|
TSDSSD= 0 |
User defined |
|
TSDSSD= 1 |
Parabolic-rectangular |
|
TSDSSD= 2 |
Bilinear |
3.4.7.6.1 Definition of the parabolic-rectangular stress-strain diagram (TSDSSD = 1):
Number of diagram points
NPSDSSD = 12
The sign criterion for the definition of points of the stress-strain diagram is as follows:
+Tension, -Compression
Strain values for this diagram are the following:
|
SDEPS (1) |
= |
ecu2 |
|
SDEPS (2) |
= |
ec2 |
|
SDEPS (3) |
= |
0.9 * ec2 |
|
SDEPS (4) |
= |
0.8 * ec2 |
|
SDEPS (5) |
= |
0.7 * ec2 |
|
SDEPS (6) |
= |
0.6 * ec2 |
|
SDEPS (7) |
= |
0.5 * ec2 |
|
SDEPS (8) |
= |
0.4 * ec2 |
|
SDEPS (9) |
= |
0.3 * ec2 |
|
SDEPS (10) |
= |
0.2 * ec2 |
|
SDEPS (11) |
= |
0.1 * ec2 |
|
SDEPS (12) |
= |
0.0 |
where:
ecu2 = -0.0035 if fck £ 50 MPa
ecu2 = -(2.6+35[(90-fck)/100]4)/1000 if fck > 50 MPa
ec2 = -0.0020 if fck £ 50 MPa
ecu2 = -(2.0+0.085(fck-50)0.53)/1000 if fck > 50 MPa
(fck in MPa)
The corresponding stress values are the following:
For the first 11 points:
SDSGM(i) = 1000*SDEPS(i) *(250*SDEPS(i) +1)*ALP*fcd_t for Eurocode 2 1991
SDSGM(i) = -[1-(1-SDEPS(i) / ec2)n]*ALP*fcd_t for Eurocode 2 2008
n = 2.0 for fck £ 50 MPa
n = 1.4+23.4*[(90-fck)/100]4 for fck > 50 MPa
For point 12:
SDSGM(i) = -ALP*fcd_t
3.4.7.6.2 Definition of the bilinear diagram (TSDSSD = 2):
Number of diagram points
NPSDSSD = 3
The sign criterion for the definition of points of the stress-strain diagram is as follows:
+Tension, -Compression
A total of 3 points (NPSDSSD = 3) has been chosen for the definition of the stress-strain diagram. Strain values conform to article Art. 4.2.1.3.3 (b) of Eurocode 2 and are the following:
|
SDEPS (1) |
= |
ecu3 |
|
SDEPS (2) |
= |
ec3 |
|
SDEPS (3) |
= |
0.000 |
Where
ecu3 = -0.0035 for fck £ 50 MPa
ecu3 = -0.001*(2.6+35*[(90-fck)/100]4) for fck > 50 MPa
ec3 = -0.00135 for fck £ 50 MPa and Eurocode 2 1991
ec3 = -0.00175 for fck £ 50 MPa and Eurocode 2 2008
ec3 = -0.001*(1.75+0.55*(fck-50)/40) for fck > 50 MPa
Stress points are the following:
|
SDSGM (1) |
= |
-ALP*fcd_t |
|
SDSGM (2) |
= |
-ALP*fcd_t |
|
SDSGM (3) |
= |
0.000 |
3.4.8 Eurocode 2 (Reinforcement Steel)
For this type of material (Type = 3) the following properties are defined:
3.4.8.1 Partial Safety Factors
|
GAMs |
Steel partial safety factor (GAMs ³ 0) gs = 1.15 (default value) |
3.4.8.2 Mechanical Properties
|
fyk |
Characteristic yield stress- Indicates the characteristic value of the applied load over the area of the transverse section. |
|
fyd |
Design yield stress. fyd = fyk/GAMs |
|
ftk |
Characteristic tensile stress. Refers to the characteristic value of the maximum axial load in tension over the area of the transverse section. |
|
EPSuk |
Characteristic elongation at maximum load. EPSuk ³ 0 |
3.4.8.3 Ductility
|
Duct |
Ductility- The default value depends on ftk, fyk and EPSuk
|
3.4.8.4 Stress-Strain Diagrams for Structural Analysis
The different types of stress-strain diagrams available are the following:
|
TSASSD= 0 |
User defined |
|
TSASSD= 1 |
Elastic |
|
TSASSD= 2 |
Bilinear |
3.4.8.4.1 Definition of the elastic diagram (TSDSSD = 1):
Number of diagram points:
NPSASSD = 2
The sign criterion for the definition of points of the stress-strain diagram is as follows:
+Tension, -Compression
Strain points are the following:
|
SAEPS (1) |
= |
-1.0E-2 |
|
SAEPS (2) |
= |
1.0E-2 |
Stress points are the following:
|
SASGM (1) |
= |
SAEPS(1)*Ex |
|
SASGM (2) |
= |
SAEPS(2)*Ex |
3.4.8.4.2 Definition of the bilinear diagram (TSDSSD = 2):
Number of diagram points:
NPSASSD = 4
The sign criterion for the definition of points of the stress-strain diagram is as follows:
+Tension, -Compression
Strain points are the following:
|
SAEPS (1) |
= |
-EPSuk |
|
SAEPS (2) |
= |
-fyk/Ex |
|
SAEPS (3) |
= |
fyk/Ex |
|
SAEPS (4) |
= |
EPSuk |
Stress points are the following:
|
SASGM (1) |
= |
-ftk |
|
SASGM (2) |
= |
-fyk |
|
SASGM (3) |
= |
fyk |
|
SASGM (4) |
= |
ftk |
3.4.8.5 Stress-Strain Diagrams for Section Analysis
The different types of stress-strain diagrams available are:
|
TSDSSD= 0 |
User defined |
|
TSDSSD= 1 |
Bilinear with horizontal top branch |
|
TSDSSD= 2 |
Bilinear with inclined top branch |
3.4.8.5.1 Definition of the bilinear diagram with horizontal top branch stress-strain (TSDSSD = 1):
Number of diagram points
NPSDSSD = 4
The sign criterion for the definition of points of the stress-strain diagram is as follows:
+Tension, -Compression
Strain points are the following:
|
SDEPS (1) |
= |
-EPSuk |
|
SDEPS (2) |
= |
-fyd/Ex |
|
SDEPS (3) |
= |
fyd/Ex |
|
SDEPS (4) |
= |
EPSuk |
The corresponding stress points are the following:
|
SDSGM (1) |
= |
-fyd |
|
SDSGM (2) |
= |
-fyd |
|
SDSGM (3) |
= |
fyd |
|
SDSGM (4) |
= |
fyd |
3.4.8.5.2 Definition of the bilinear diagram with inclined top branch stress-strain (TSDSSD = 2):
Number of diagram points
NPSDSSD = 4
The sign criterion for the definition of points of the stress-strain diagram is as follows:
+Tension, -Compression
Strain points are the following:
|
SDEPS (1) |
= |
-EPSuk |
|
SDEPS (2) |
= |
-fyd/Ex |
|
SDEPS (3) |
= |
fyd/Ex |
|
SDEPS (4) |
= |
EPSuk |
The corresponding stress points are the following:
|
SDSGM (1) |
= |
-ftk/GAMs |
|
SDSGM (2) |
= |
-fyd |
|
SDSGM (3) |
= |
fyd |
|
SDSGM (4) |
= |
ftk/GAMs |
3.4.9 Eurocode 2 (Prestressing steel)
For this type of material (Type = 4) the following properties are defined:
3.4.9.1 Safety Factors
|
GAMs |
Safety factor (GAMs ³ 1) |
3.4.9.2 Mechanical Properties
|
fpk |
Characteristic tensile strength. fpk³0 |
|
fp01 |
0.1% Proof-stress. fp01³0 |
|
EPSuk |
Characteristic elongation at maximum load. EPSuk ³ 0 (by default = 0.035) |
3.4.9.3 Relaxation
|
Ro_60 |
Relaxation for 1000hours and 60%fmax. |
|
Ro_70 |
Relaxation for 1000hours and 70%fmax. |
|
Ro_80 |
Relaxation for 1000hours and 80%fmax. |
|
LtRat |
Ratio between long-term relaxation losses and 1000 hours relaxation losses. |
3.4.9.4 Stress-Strain Diagrams for Structural Analysis
The different types of stress-strain diagrams are the following:
|
TSASSD= 0: |
User defined |
|
TSASSD= 1: |
Elastic |
|
TSASSD= 2: |
Bilinear |
3.4.9.4.1 Definition of the Bilinear diagram (TSDSSD = 1):
Number of diagram points
NPSASSD = 2
The sign criterion for the definition of points of the stress-strain diagram is as follows:
+Tension, -Compression
Strain points are the following:
|
SAEPS (1) |
= |
-10-2 |
|
SAEPS (2) |
= |
10-2 |
The corresponding stress points are the following:
|
SASGM (1) |
= |
SAEPS (1)·Ex |
|
SASGM (2) |
= |
SAEPS (2)·Ex |
3.4.9.4.2 Definition of the Bilinear diagram (TSDSSD = 2):
Number of diagram points
NPSASSD = 3
The sign criterion for the definition of points of the stress-strain diagram is as follows:
+Tension, -Compression
Strain points are the following:
|
SAEPS (1) |
= |
0.0 |
|
SAEPS (2) |
= |
0.9·fpk/Ex |
|
SAEPS (3) |
= |
EPSuk |
The corresponding stress points are the following:
|
SASGM (1) |
= |
0.0 |
|
SASGM (2) |
= |
0.9·fpk |
|
SASGM (3) |
= |
fpk |
3.4.9.5 Stress-Strain Diagrams for Section Analysis
The different types of stress-strain diagrams are the following:
|
TSDSSD= 0: |
User-defined |
|
TSDSSD= 1: |
Bilinear with horizontal top branch |
|
TSDSSD= 2: |
Bilinear with inclined top branch |
3.4.9.5.1 Definition of the bilinear diagram with horizontal top branch stress-strain (TSDSSD = 1):
Number of diagram points:
NPSDSSD = 3
The sign criterion for the definition of points of the stress-strain diagram is as follows:
+Tension, -Compression
Strain points are the following:
|
SDEPS (1) |
= |
0.0 |
|
SDEPS (2) |
= |
0.9·fpk/(Ex.GAMs) |
|
SDEPS (3) |
= |
EPSuk |
The corresponding stress points are the following:
|
SDSGM (1) |
= |
0.0 |
|
SDSGM (2) |
= |
0.9·fpk/GAMs |
|
SDSGM (3) |
= |
0.9·fpk/GAMs |
3.4.9.5.2 Definition of the bilinear diagram with inclined top branch stress-strain (TSDSSD = 2):
Number of diagram points
NPSDSSD = 3
The sign criterion for the definition of points of the stress-strain diagram is as follows:
+Tension, -Compression
Strain points are the following:
|
SDEPS (1) |
= |
0.0 |
|
SDEPS (2) |
= |
0.9·fpk/(Ex.GAMs) |
|
SDEPS (3) |
= |
EPSuk |
The corresponding stress points are the following:
|
SDSGM (1) |
= |
0.0 |
|
SDSGM (3) |
= |
0.9·fpk/GAMs |
|
SDSGM (4) |
= |
fpk/GAMs |
3.4.10 ACI (Concrete)
For this type of material (Type = 2) the following properties are defined:
3.4.10.1 Type of Cement and Curing
|
CuTp |
Type of curing (ACI-219R-4 Art. 2.2.1) MOIST: moist cured (default value) STEAM: steam cured |
|
CeTp |
Type of cement (ACI-219R-4 Art. 2.2.1) I: cement type I (default value) III: cement type III |
3.4.10.2 Mechanical Properties
|
fc |
Specified compressive strength (Art. 5.1 of the ACI-318) (+ Compression) |
||||||||||||
|
a |
Constant which depends on the type of cement and curing (table 2.2.1 of the ACI-209R-4).
|
||||||||||||
|
BET |
Constant which depends on the type of cement and curing (table 2.2.1 of the ACI-209R-4).
|
3.4.10.3 Time Dependent Mechanical Properties
|
fc_t(Age) |
Concrete compressive strength (ACI-209R-4 Art. 2.2.1) (+ Compression) fc_t = Age / (a+BET*Age)*fc |
||||||
|
fr (Age) |
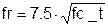
Modulus
of rupture (ACI-318 Art. 9.5.2.3) |
||||||
|
Ec(Age) |
Modulus of elasticity (Art. 8.5.1 of the ACI-318) Ec = Wc1.5*33*fc_t1/2 / Wc £ 155 (Wc in lb/ft3) |
||||||
|
BET1 |
Factor that allows transforming the parabolic stress distribution of the beam compressive zone to a rectangular one (Art. 10.2.7.3 of the ACI-318). This factor b1 varies depending on the concrete characteristic strength. The different values this factor may have are described bellow:
Note: All these formulae are valid for a fc of 28 days. |
||||||
|
EPS0(Age) |
Strain of the maximum compressive stress for parabolic stress-strain diagram (Parabolic Stress strain diagram provided by PCA) (+Compression) EPS0 = 2* (0.85*fc_t)/Ec |
3.4.10.4 Stress-Strain Diagrams for Structural Analysis
The different types of stress-strain diagrams available for concrete, according to the ACI code are the following:
|
TSASSD= 0: |
User defined |
|
TSASSD= 1: |
Elastic |
|
TSASSD= 2: |
PCA Parabolic |
3.4.10.4.1 Definition of the elastic stress-strain diagram (TSASSD = 1):
The sign criterion for the definition of stress-strain diagram points is as follows:
+Tension, -Compression
A total of 2 points (NPSASSD = 2) has been chosen for the definition of the stress-strain diagram. Strain values are the following:
|
SAEPS (1) |
= |
-1.0E-2 |
|
SAEPS (2) |
= |
1.0E-2 |
For these points, stress values are the following:
|
SASGM (i) = SAEPS (i) * Ex |
3.4.10.4.2 Definition of the PCA parabolic stress-strain diagram (TSASSD = 2):
Number of diagram points
NPSASSD = 12
The sign criterion for the definition of points of the stress-strain diagram is as follows:
+Tension, -Compression
Strain points have been taken according to notes expressed in ACI-318 article Art. 10.2.6 and are the following:
|
SAEPS (1) |
= |
-0.0030 |
|
SAEPS (2) |
= |
-EPS0 |
|
SAEPS (3) |
= |
-9/10*EPS0 |
|
SAEPS (4) |
= |
-8/10*EPS0 |
|
SAEPS (5) |
= |
-7/10*EPS0 |
|
SAEPS (6) |
= |
-6/10*EPS0 |
|
SAEPS (7) |
= |
-5/10*EPS0 |
|
SAEPS (8) |
= |
-4/10*EPS0 |
|
SAEPS (9) |
= |
-3/10*EPS0 |
|
SAEPS (10) |
= |
-2/10*EPS0 |
|
SAEPS (11) |
= |
-1/10*EPS0 |
|
SAEPS (12) |
= |
0.000 |
Stress points are the following:
If 0 > SAEPS(i) > (-EPS0)
|
SASGM(i) = |
0.85*fc_t*[2*(SAEPS(i) /-EPS0)-(SAEPS(i) /-EPS0)2] |
If (-EPS0) > SAEPS(i)
|
SASGM(i) = |
0.85*fc_t |
3.4.10.5 Stress-Strain Diagrams for Section Analysis
The different types of stress-strain diagrams available for concrete, according to the ACI code are the following:
|
TSDSSD= 0: |
User defined |
|
TSDSSD= 1: |
PCA Parabolic |
|
TSDSSD= 2: |
Rectangular |
|
TSDSSD= 3 |
Linear |
|
TSDSSD=4 |
Parabolic (ACI359) |
3.4.10.5.1 Definition of the PCA Parabolic diagram (TSDSSD = 1):
Number of diagram points
NPSDSSD = 12
The sign criterion for the definition of points of the stress-strain diagram is as follows:
+Tension, -Compression
Strain points have been taken according to notes expressed in ACI-318 article Art. 10.2.6 and are the following:
|
SDEPS (1) |
= |
-0.0030 |
|
SDEPS (2) |
= |
-EPS0 |
|
SDEPS (3) |
= |
-9/10*EPS0 |
|
SDEPS (4) |
= |
-8/10*EPS0 |
|
SDEPS (5) |
= |
-7/10*EPS0 |
|
SDEPS (6) |
= |
-6/10*EPS0 |
|
SDEPS (7) |
= |
-5/10*EPS0 |
|
SDEPS (8) |
= |
-4/10*EPS0 |
|
SDEPS (9) |
= |
-3/10*EPS0 |
|
SDEPS (10) |
= |
-2/10*EPS0 |
|
SDEPS (11) |
= |
-1/10*EPS0 |
|
SDEPS (12) |
= |
0.000 |
The corresponding stress points are the following:
If 0 > SDEPS(i) > (-EPS0)
SDSGM (i) = 0.85*fc_t*[2*(SDEPS(i) /-EPS0)-(SDEPS(i) /-EPS0)2]
If (-EPS0) > SDEPS
SDSGM (i) = 0.85*fc_t
3.4.10.5.2 Definition of the rectangular diagram (TSDSSD = 2):
Number of diagrams points
NPSDSSD = 0
Specific points for rectangular diagrams are not defined because stresses do not depend on strains, but on the distance between the outer most compressed fiber and the neutral axis.
3.4.10.5.3 Construction of the elastic stress-strain diagram (TSASSD = 3):
The sign criteria for the definition of stress-strain diagram points is as follows:
+Tension, -Compression
A total of 2 points (NPSASSD = 2) have been selected for the construction of the stress-strain diagram. Strain values are the following:
|
SAEPS (1) |
= |
-1.0E-2 |
|
SAEPS (2) |
= |
1.0E-2 |
For these points, stress values are the following:
|
SASGM (i) = SAEPS (i) * Ex |
3.4.10.5.4 Construction of the Parabolic (ACI359) diagram(TSDSSD = 4):
Number of diagram points
NPSDSSD = 12
The sign criteria for the definition of points of the stress-strain diagram is as follows:
+Tension, -Compression
Strain points have been taken according to the code ACI 359-04 and are the following:
|
SDEPS (1) |
= |
-0.003 |
|
SDEPS (2) |
= |
-0.002 |
|
SDEPS (3) |
= |
-9/10*0.002 |
|
SDEPS (4) |
= |
-8/10*0.002 |
|
SDEPS (5) |
= |
-7/10*0.002 |
|
SDEPS (6) |
= |
-6/10*0.002 |
|
SDEPS (7) |
= |
-5/10*0.002 |
|
SDEPS (8) |
= |
-4/10*0.002 |
|
SDEPS (9) |
= |
-3/10*0.002 |
|
SDEPS (10) |
= |
-2/10*0.002 |
|
SDEPS (11) |
= |
-1/10*0.002 |
|
SDEPS (12) |
= |
0.000 |
The corresponding stress points are the following:
If 0 > SDEPS(i) > (-0.002)
SDSGM (i) = 0.85*fc_t*[2*(SDEPS(i) /-0.002)-(SDEPS(i) /-0.002)2]
If (-0.002) > SDEPS
SDSGM (i) = 0.85*fc_t*[1-0.15*[( SDEPS(i)+0.002)/(0.002-0.003)]]
3.4.11 ACI (Reinforcement steel)
For this type of material (Type = 3) the following properties are considered:
3.4.11.1 Mechanical Properties
|
fy |
Yield strength (Art. 3.5 of the ACI-318) |
3.4.11.2 Stress-Strain Diagrams for Structural Analysis
The different types of stress-strain diagrams available for reinforcement steel, according to the ACI code are the following:
|
TSASSD= 0 |
User defined |
|
TSASSD= 1 |
Elastic |
|
TSASSD= 2 |
Bilinear |
3.4.11.2.1 Definition of the elastic diagram (TSASSD = 1):
Number of diagram points:
NPSASSD = 2
The sign criterion for the definition of points of the stress-strain diagram is as follows:
+Tension, -Compression
Strain values for the stress-strain diagram have been taken as:
|
SAEPS (1) |
= |
-1.0E-2 |
|
SAEPS (2) |
= |
1.0E+2 |
The corresponding stress values are:
|
SASGM (1) |
= |
SAEPS(1)*Ex |
|
SASGM (2) |
= |
SAEPS(2)*Ex |
3.4.11.2.2 Definition of the bilinear diagram (TSASSD = 2):
Number of diagram points:
NPSASSD = 4
The sign criterion for the definition of points of the stress-strain diagram is as follows:
+Tension, -Compression
Strain values for the stress-strain diagram have been taken as:
|
SAEPS (1) |
= |
-0.01 |
|
SAEPS (2) |
= |
-fy/Ex |
|
SAEPS (3) |
= |
fy/Ex |
|
SAEPS (4) |
= |
0.01 |
The corresponding stress values are:
|
SASGM (1) |
= |
-fy |
|
SASGM (2) |
= |
-fy |
|
SASGM (3) |
= |
Fy |
|
SASGM (4) |
= |
Fy |
3.4.11.3 Stress-Strain Diagram for Section Analysis
The different types of stress-strain diagrams available for reinforcement steel, according to the ACI code are the following:
|
TSDSSD= 0 |
User defined |
|
TSDSSD= 1 |
Bilinear |
3.4.11.3.1 Definition of the bilinear diagram (TSDSSD = 1):
Number of diagrams points
NPSDSSD = 4
The sign criterion for the definition of points of the stress-strain diagram is as follows:
+Tension, -Compression
Strain values for the stress-strain diagram have been taken as:
|
SDEPS (1) |
= |
-0.01 |
|
SDEPS (2) |
= |
-fy/Ex |
|
SDEPS (3) |
= |
fy/Ex |
|
SDEPS (4) |
= |
0.01 |
The corresponding stress values are:
|
SDSGM (1) |
= |
-fy |
|
SDSGM (2) |
= |
-fy |
|
SDSGM (3) |
= |
Fy |
|
SDSGM (4) |
= |
Fy |
3.4.12 ACI (Prestressing steel)
For this type of material (Type = 4) the following properties are considered:
3.4.12.1 Mechanical properties
|
StTp |
Prestessing steel type
|
||||
|
fpu |
Specific tension strenght |
||||
|
fpy |
Yield strength |
3.4.12.2 Relaxation
|
Rlcf1 |
Coefficient 1 for the relaxation calculation |
|
Rlcf2 |
Coefficient 1 for the relaxation calculation |
3.4.12.3 Stress-strain diagrams for structural analysis
The different types of stress-strain diagrams available for prestressing steel, according to the ACI code are the following:
|
TSASSD= 0 |
User defined |
|
TSASSD= 1 |
Elastic |
|
TSASSD= 2 |
Bilinear |
3.4.12.3.1 Definition of the elastic diagram (TSASSD = 1):
Number of diagram points
NPSASSD = 2
The sign criterion for the definition of points of the stress-strain diagram is as follows:
+Tension, -Compression
Strain values for the stress-strain diagram have been taken as:
|
SAEPS (1) |
= |
-10-2 |
|
SAEPS (2) |
= |
10-2 |
The corresponding stress values are:
|
SASGM (1) |
= |
SAEPS (1)·Ex |
|
SASGM (2) |
= |
SAEPS (2)·Ex |
3.4.12.3.2 Definition of the bilinear diagram (TSASSD = 2):
Number of diagram points
NPSASSD = 3
The sign criterion for the definition of points of the stress-strain diagram is as follows:
+Tension, -Compression
Strain values for the stress-strain diagram have been taken as:
|
SAEPS (1) |
= |
0.0 |
|
SAEPS (2) |
= |
fpy/Ex |
|
SAEPS (3) |
= |
0.035 |
The corresponding stress values are:
|
SASGM (1) |
= |
0.0 |
|
SASGM (2) |
= |
fpy |
|
SASGM (3) |
= |
fpu |
3.4.12.4 Stress-Strain Diagram for Section Analysis
The different types of stress-strain diagrams available for prestressing steel, according to the ACI code are the following:
|
TSDSSD= 0 |
User defined |
|
TSDSSD= 1 |
Bilinear |
3.4.12.4.1 Definition of the bilinear diagram (TSDSSD = 1):
Number of diagrams points
NPSDSSD = 3
The sign criterion for the definition of points of the stress-strain diagram is as follows:
+Tension, -Compression
Strain values for the stress-strain diagram have been taken as:
|
SDEPS (1) |
= |
0.0 |
|
SDEPS (2) |
= |
fpy/Ex |
|
SDEPS (3) |
= |
0.035 |
The corresponding stress values are:
|
SDSGM (1) |
= |
0.0 |
|
SDSGM (2) |
= |
fpy |
|
SDSGM (3) |
= |
fpu |
3.4.13 CEB-FIP (Concrete)
For this type of material (Type = 2) the following properties are defined:
3.4.13.1 Type of Cement
|
CeTp |
Type of cement (appendix d.4.2.1)
|
3.4.13.2 Safety Factors
|
GAMc |
Partial
safety factor for concrete (Art. 1.6.4.4) (GAMc ³ 1) |
3.4.13.3 Mechanical Properties
|
fck |
Characteristic compressive strength (+ Compression) fck ³ 0 |
||||||||
|
fcd |
Design compressive strength at 28 days (Art. 1.4.1 b) (+ Compression) fcd = fck/GAMc |
||||||||
|
fcm |
Mean compressive strength (Art. 2.1.3.2) (+ Compression fcm ³ 0) fcm = fck + 8 N/mm2, in which fcm, and fck are in N/mm2. |
||||||||
|
fctk_min |
Lower characteristic tensile strength (Art. 2.1.3.3.1 (2.1-2)) (+ Tension) fctk_min = 0.95*[(fck/10)2/3] (fctk_min and fck in N/mm2) |
||||||||
|
fctk_max |
Upper characteristic tensile strength (Art. 2.1.3.3.1 (2.1-3)) (+ Tension) fctk_max = 1.85*[(fck/10)2/3] (fctk_max and fck in N/mm2) |
||||||||
|
fctm |
Mean tensile strength (Art. 2.1.3.3.1 (2.1-4)) (+ Tension) fctm = 1.40*[(fck/10)2/3] (fctm and fck in N/mm2) |
||||||||
|
s |
Coefficient which depends on the type of cement and is used to calculate the characteristic concrete resistance at a specific age (Art. 2.1.6.1)
|
3.4.13.4 Time dependent mechanical properties
|
BETcc(Age) |
Coefficient which depends on concrete age (Art. 2.1.6.1 (2.1-54)) BETcc = exp {s*[1-(28/Age)1/2]} (Age is expressed in days.) |
||||||
|
fcm_t(Age) |
Mean t day compressive strength (Art. 2.1.6.1 (2.1-53)) (+Compression) fcm_t = BETcc*fcm |
||||||
|
fck_t(Age) |
Characteristic t-day compressive strength (Art. 2.1.3.2) (+Compression) fck_t = fcm_t - 8 (in MPa) |
||||||
|
fcd_t(Age) |
Design t-day compressive strength (Art. 1.4.1 b) (+Compression) fcd_t = fck_t/GAMc |
||||||
|
fcd1(Age) |
Uniform strength for uncracked regions (Art. 6.2.2.2) fcd1 = 0.85*(1-fck_t/250)*fcd_t (fcd1, fck_t and fcd_t in N/mm2) |
||||||
|
fcd2(Age) |
Uniform strength for cracked regions (Art. 6.2.2.2) fcd2 = 0.60*(1-fck_t/250)*fcd_t (fcd2, fck_t and fcd_t in N/mm2) |
||||||
|
k |
Strength ratio. This coefficient refers to the ratio of tension over compression resistance. Its value is taken from article (Art. 2.1.3.4) K = fctm / fcm |
||||||
|
Eci(Age) |
Tangent modulus of elasticity (Art. 2.1.4.2) Eci = (BETcc)1/2 *2.15E4*{[(fcm_t)/10]1/3} (in N/mm2) |
||||||
|
Ec(Age) |
Reduced modulus of elasticity (article 2.1.4.2) Ec = 0.85*Eci |
||||||
|
Ec1(Age) |
Secant modulus of elasticity (Art. 2.1.4.4.1) Ec1 = (BETcc)1/2 *fcm_t/(-EPSc1) |
||||||
|
EPSc1 |
Strain
of the maximum compressive stress (Art. 2.1.4.4.1) |
||||||
|
EPSc_lim(Age)(LIBR) |
Maximum concrete strain in compression (Art. 2.1.4.4.1)
|
||||||
|
EPScuB |
Maximum strain in bending for a parabolic rectangular diagram (Art. 6.2.2.2 (6.2-2)). This strain varies with the concrete characteristic strength, following the criteria specified bellow: (+ Compression)
|
||||||
|
EPScuC |
Maximum strain in compression for a parabolic rectangular diagram (Art. 6.2.2.2 (6.2-6)) (+ Compression) EPScuC = 0.0035 |
||||||
|
EPScuU |
Maximum strain for a uniform stress diagram (Art. 6.2.2.2 (6.2-6)) (+Compression) EPScuU = 0.004 - 0.002*(fck/100) (in N/mm2) |

3.4.13.5 Stress-Strain Diagram for Structural Analysis
The different types of stress-strain diagrams available for concrete, according to CEB-FIP code are the following:
|
TSASSD= 0: |
User defined |
|
TSASSD= 1: |
Elastic |
|
TSASSD= 2: |
Instantaneous loading |
3.4.13.5.1 Definition of the elastic stress-strain diagram (TSASSD = 1):
The sign criterion for the definition of stress-strain diagram points is as follows:
+Tension, -Compression
A total of 2 points (NPSASSD = 2) has been chosen for the definition of the stress-strain diagram. Strain values are the following:
|
SAEPS (1) |
= |
-10-2 |
|
SAEPS (2) |
= |
10-2 |
For these points, stress values are the following:
|
SASGM (i) = SAEPS (i) * Ex |
3.4.13.5.2 Definition of the Instantaneous loading stress-strain diagram (TSASSD = 2):
Number of diagram points
NPSASSD = 20
The sign criterion for the definition of points of the stress-strain diagram is as follows:
+Tension, -Compression
Strain point values conform to article Art. 2.1.4.4.1 and are the following:
|
SAEPS (1) |
= |
1.000*(EPSc_lim-EPSc1) + EPSc1 |
|
SAEPS (2) |
= |
0.793*(EPSc_lim-EPSc1) + EPSc1 |
|
SAEPS (3) |
= |
0.617*(EPSc_lim-EPSc1) + EPSc1 |
|
SAEPS (4) |
= |
0.468*(EPSc_lim-EPSc1) + EPSc1 |
|
SAEPS (5) |
= |
0.342*(EPSc_lim-EPSc1) + EPSc1 |
|
SAEPS (6) |
= |
0.234*(EPSc_lim-EPSc1) + EPSc1 |
|
SAEPS (7) |
= |
0.143*(EPSc_lim-EPSc1) + EPSc1 |
|
SAEPS (8) |
= |
0.066*(EPSc_lim-EPSc1) + EPSc1 |
|
SAEPS (9) |
= |
1.000*EPSc1 |
|
SAEPS (10) |
= |
0.964*EPSc1 |
|
SAEPS (11) |
= |
0.922*EPSc1 |
|
SAEPS (12) |
= |
0.873*EPSc1 |
|
SAEPS (13) |
= |
0.816*EPSc1 |
|
SAEPS (14) |
= |
0.749*EPSc1 |
|
SAEPS (15) |
= |
0.669*EPSc1 |
|
SAEPS (16) |
= |
0.575*EPSc1 |
|
SAEPS (17) |
= |
0.465*EPSc1 |
|
SAEPS (18) |
= |
0.335*EPSc1 |
|
SAEPS (19) |
= |
0.181*EPSc1 |
|
SAEPS (20) |
= |
0.000 |
The corresponding stress values are:
|
SASGM (i) = |
[((Eci/Ec1*SAEPS(i) /EPSc1)-(SAEPS(i) /EPSc1)2)/ /(1+(Eci/Ec1-2)*SAEPS(i) /EPSc1)]*fcm_t |
3.4.13.6 Stress-Strain Diagrams for Section Analysis
The different types of stress-strain diagrams available for concrete, according to CEB-FIP code are the following:
|
TSDSSD= 0 |
User defined |
|
TSDSSD= 1 |
Parabolic rectangular |
|
TSDSSD= 2 |
Uniform stress |
3.4.13.6.1 Definition of the parabolic rectangular diagram (TSDSSD = 1):
Number of diagram points
NPSDSSD = 12
The sign criterion for the definition of points of the stress-strain diagram is as follows:
+Tension, -Compression
Strain point values conform to article Art. 6.2.2.2 and are the following:
|
SDEPS (1) |
= |
-EPScuB |
|
SDEPS (2) |
= |
EPSc1 |
|
SDEPS (3) |
= |
9/10*EPSc1 |
|
SDEPS (4) |
= |
8/10*EPSc1 |
|
SDEPS (5) |
= |
7/10*EPSc1 |
|
SDEPS (6) |
= |
6/10*EPSc1 |
|
SDEPS (7) |
= |
5/10*EPSc1 |
|
SDEPS (8) |
= |
4/10*EPSc1 |
|
SDEPS (9) |
= |
3/10*EPSc1 |
|
SDEPS (10) |
= |
2/10*EPSc1 |
|
SDEPS (11) |
= |
1/10*EPSc1 |
|
SDEPS (12) |
= |
0.000 |
The corresponding stress point values are the following:
If SDEPS(i) > EPSc1
SDSGM (i) = -0.85*fcd_t*[2*(SDEPS(i) /-EPSc1)+(SDEPS(i) /-EPSc1)2]
If SDEPS(i) < EPSc1
SDSGM(i) = -0.85*fcd_t
3.4.13.6.2 Definition of uniform stress stress-strain diagrams (TSDSSD = 2):
Number of diagram points:
NPSDSSD = 3
The sign criterion for the definition of points of the stress-strain diagram is as follows:
+Tension, -Compression
Strain point values conform to article Art. 6.2.2.2 and are the following:
|
SDEPS (1) |
= |
-EPSc1 |
|
SDEPS (2) |
= |
-EPSc1/1000 |
|
SDEPS (2) |
= |
0.000 |
The corresponding stress point values are the following:
|
SDSGM (1) |
= |
-fcd2 |
|
SDSGM (2) |
= |
-fcd2 |
|
SDSGM (3) |
= |
0.00 |
3.4.14 CEB-FIP (Reinforcement Steel)
For this type of material (Type = 3) the following properties are defined:
3.4.14.1 Safety Factors
|
GAMs |
Steel safety factor (Art. 1.6.4.4) gs = 1.15 |
3.4.14.2 Mechanical Properties
|
fyk |
Characteristic yield stress (Art. 2.2.4.1) (fyk ³ 0) |
||||||||||||
|
fyd |
Design yield stress (Art. 1.4.1 b) fyd = fyk/GAMs |
||||||||||||
|
ftk |
Characteristic tensile strength (Art. 2.2.4.1) ftk ³ 0 |
||||||||||||
|
EPSuk |
Characteristic elongation at maximum load (Art. 2.2.4.1) EPSuk ³ 0 |
||||||||||||
|
Duct |
Steel ductility (Art. 2.2.4.4)
|
3.4.14.3 Stress-Strain Diagrams for Structural Analysis
The different types of stress-strain diagrams available for reinforcement steel, according to CEB-FIP code are the following:
|
TSASSD= 0 |
User defined |
|
TSASSD= 1 |
Elastic |
|
TSASSD= 2 |
Bilinear |
3.4.14.3.1 Definition of the bilinear diagram (TSASSD = 1):
Number of diagram points:
NPSASSD = 2
The sign criterion for the definition of points of the stress-strain diagram is as follows:
+Tension, -Compression
Strain point values conforming to article Art. 2.2.4.3 and are the following:
|
SAEPS (1) |
= |
-1.0E-2 |
|
SAEPS (2) |
= |
1.0E2 |
The corresponding stress points are:
|
SASGM (1) |
= |
SAEPS(1)*Ex |
|
SASGM (2) |
= |
SAEPS(2)*Ex |
3.4.14.3.2 Definition of the bilinear diagram (TSASSD = 2):
Number of diagram points:
NPSASSD = 4
The sign criterion for the definition of points of the stress-strain diagram is as follows:
+Tension, -Compression
Strain point values conform to article Art. 2.2.4.3 and are the following:
|
SAEPS (1) |
= |
-EPSuk |
|
SAEPS (2) |
= |
-fyk/Ex |
|
SAEPS (3) |
= |
fyk/Ex |
|
SAEPS (4) |
= |
EPSuk |
The corresponding stress points are:
|
SASGM (1) |
= |
-fyk |
|
SASGM (2) |
= |
-fyk |
|
SASGM (3) |
= |
fyk |
|
SASGM (4) |
= |
fyk |
3.4.14.4 Stress-Strain Diagrams for Section Analysis
The different types of stress-strain diagrams available for reinforcement steel, according to CEB-FIP code are the following:
|
TSDSSD= 0 |
User defined |
|
TSDSSD= 1 |
Bilinear |
3.4.14.4.1 Definition of the bilinear diagram (TSDSSD = 1):
Number of diagram points
NPSDSSD = 4
The sign criterion for the definition of points of the stress-strain diagram is as follows:
+Tension, -Compression
Strain point values conform to article Art. 2.2.4.3 and are the following:
|
SDEPS (1) |
= |
-0.01 |
|
SDEPS (2) |
= |
-fyd/Ex |
|
SDEPS (3) |
= |
fyd/Ex |
|
SDEPS (4) |
= |
0.01 |
The corresponding stress points are:
|
SDSGM (1) |
= |
-fyd |
|
SDSGM (2) |
= |
-fyd |
|
SDSGM (3) |
= |
fyd |
|
SDSGM (4) |
= |
fyd |
3.4.15 EHE (Concrete)
For this type of material (Type = 2) the following properties according to EHE are described hereafter:
3.4.15.1 Type of Cement
|
CeTp |
Type of cement. The different types of cement are described in article Art. 30.4 and are the following:
|
3.4.15.2 Safety Factors
|
GAMc |
Partial concrete safety factor (Art. 15.3) GAMc =1.5 (default value) |
3.4.15.3 Mechanical Properties
|
fck |
Characteristic 28-day concrete compressive strength (+ Compression fck ³ 0) |
||||
|
fcm |
Mean 28-day concrete compressive strength (Art. 39.6) (+ Compression fcm ³ 0) fcm = fck + 8 (N/mm2). |
||||
|
fcd |
Design 28-day concrete compressive strength (Art. 39.4) (+ Compression) fcd = fck/GAMc |
||||
|
fctm |
Mean tensile strength (Art. 39.1) (+ Tension) fctm = 0.3*(fck2/3) (N/mm2) |
||||
|
fctk_005 |
Lower characteristic tensile strength (percentile-5%) (Art. 39.1) (+ Tension) fctk_005 = 0.21*(fck2/3) (N/mm2) |
||||
|
fctk_095 |
Upper characteristic tensile strength (percentile-95%) (Art. 39.1) (+ Tension) fctk_095 = 0.39*( fck2/3) (N/mm2) |
||||
|
EPSc1 |
Strain of maximum compressive stress (Art. 21.3.3 which) (+ Compression) EPSc1 = 0.0022 (default value) |
||||
|
EPSclim |
Maximum strain in compression (Art. 21.3.3 Table 21.3.3) (+Compression EPSclim ³ 0): According
to CEB-FIP, Art. 2.1.4.4.1: |
||||
|
Eci |
Tangent modulus of elasticity (Art. 21.3.3 Table 21.3.3) (Eci ³ 0) According to the Art. 2.1.4.4.1 of the CEB-FIP code Eci=2.15*((fcm/10)1/3) (in MPa) |
||||
|
K |
Coefficient which depends on the type of cement used. The value of this factor can be found in the commentary of article Art. 30.4 which states the following: 0< K < 1
|

3.4.15.4 Time Dependent Mechanical Properties
|
BETc(Age) |
Coefficient which depends on concrete age (Art. 30.4) BETc = exp {K*[1-(28/Age)1/2]} (Age is expressed in days) |
|
fck_j(Age) |
Characteristic
compressive strength (Art. 39.6) (+ Compression) |
|
fcm_j(Age) |
Mean
compressive strength (Art. 39.6) (+ Compression) |
|
fcd_j(Age) |
Design
j day compressive strength (Art. 39.4) (+ Compression) |
|
BETt(Age) |
Coefficient which depends on concrete age. This coefficient has been taken from article (Art. 30.4) BETt = exp {0.10*[1-(28/Age)]} (Age is expressed in days) |
|
fctm_j(Age) |
Mean tensile strength (Art. 30.4) (+ Tension) fctm_j = fctm*BETt |
|
E0j (Age) |
Tangent modulus of elasticity (Art. 39.6) E0j = (BETc)1/2 *10000*(fcm_j1/3) (N/mm2) |
|
Ej (Age) |
Secant modulus of elasticity (Art. 39.6) Ej = (BETc)1/2 *8500*(fcm_j1/3) (N/mm2) |
3.4.15.5 Stress-Strain Diagrams for Structural Analysis
The different types of stress-strain diagrams available for concrete, according to EHE code are the following:
|
TSASSD= 0: |
User defined |
|
TSASSD= 1: |
Elastic |
|
TSASSD= 2: |
Instantaneous loading |
3.4.15.5.1 Definition of the elastic stress-strain diagram (TSASSD = 1):
The sign criterion for the definition of stress-strain diagram points is as follows:
+Tension, -Compression
A total of 2 points (NPSASSD = 2) has been chosen for the definition of the stress-strain diagram. Strain values are the following:
|
SAEPS (1) |
= |
-10-2 |
|
SAEPS (2) |
= |
10-2 |
For these points, stress values are the following:
|
SASGM (i) = SAEPS (i) * Ex |
3.4.15.5.2 Definition of the instantaneous loading stress-strain diagram (TSASSD = 2):
Number of diagram points
NPSASSD = 20
The sign criterion for the definition of points of the stress-strain diagram is as follows:
+Tension, -Compression
Strain point values conform to article Art. 21.3.3 and are the following:
|
SAEPS (1) |
= |
-EPSclim |
|
SAEPS (2) |
= |
-0.793*(EPSclim-EPSc1)-EPSc1 |
|
SAEPS (3) |
= |
-0.617*(EPSclim-EPSc1)-EPSc1 |
|
SAEPS (4) |
= |
-0.468*(EPSclim-EPSc1)-EPSc1 |
|
SAEPS (5) |
= |
-0.342*(EPSclim-EPSc1)-EPSc1 |
|
SAEPS (6) |
= |
-0.234*(EPSclim-EPSc1)-EPSc1 |
|
SAEPS (7) |
= |
-0.143*(EPSclim-EPSc1)-EPSc1 |
|
SAEPS (8) |
= |
-0.066*(EPSclim-EPSc1)-EPSc1 |
|
SAEPS (9) |
= |
-EPSc1 |
|
SAEPS (10) |
= |
-0.964*EPSc1 |
|
SAEPS (11) |
= |
-0.922*EPSc1 |
|
SAEPS (12) |
= |
-0.873*EPSc1 |
|
SAEPS (13) |
= |
-0.816*EPSc1 |
|
SAEPS (14) |
= |
-0.749*EPSc1 |
|
SAEPS (15) |
= |
-0.669*EPSc1 |
|
SAEPS (16) |
= |
-0.575*EPSc1 |
|
SAEPS (17) |
= |
-0.465*EPSc1 |
|
SAEPS (18) |
= |
-0.335*EPSc1 |
|
SAEPS (19) |
= |
-0.181*EPSc1 |
|
SAEPS (20) |
= |
0.000 |
The corresponding stress points are the following:
SASGM(i)= -[(k*Eta(i)-Eta(i)^2)/(1+(k-2)*Eta)]*fcm_j
Where:
K = Eci*EPSc1/(fcm_j(28))
Eta(i) = -SAEPS(i)/EPSc1
3.4.15.6 Stress-Strain Diagram for Section Analysis
The different types of stress-strain diagrams available for concrete, according to the EHE code are the following:
|
TSDSSD= 0 |
User defined |
|
TSDSSD= 1 |
Parabolic rectangular |
|
TSDSSD= 2 |
Bilinear |
|
TSDSSD= 3 |
Rectangular |
3.4.15.6.1 Definition of the parabolic rectangular stress-strain diagram (TSDSSD = 1):
Number of diagram points
NPSDSSD = 12
The sign criterion for the definition of points of the stress-strain diagram is as follows:
+Tension, -Compression
Strain point values conform to article Art. 39.5 a) and are the following:
|
SDEPS (1) |
= |
-EPSmin |
|
SDEPS (2) |
= |
-EPSint |
|
SDEPS (3) |
= |
-9/10* EPSint |
|
SDEPS (4) |
= |
-8/10* EPSint |
|
SDEPS (5) |
= |
-7/10* EPSint |
|
SDEPS (6) |
= |
-6/10* EPSint |
|
SDEPS (7) |
= |
-5/10* EPSint |
|
SDEPS (8) |
= |
-4/10* EPSint |
|
SDEPS (9) |
= |
-3/10* EPSint |
|
SDEPS (10) |
= |
-2/10* EPSint |
|
SDEPS (11) |
= |
-1/10* EPSint |
|
SDEPS (12) |
= |
0.000 |
The corresponding stress points are the following:
EHE-98
For the first 11 points:
SDSGM (i) = 1000*SDEPS(i) *[250*SDEPS(i) +1]*0.85*fcd_j
For point 12:
SDSGM (i) = 0.85*fcd_j
EHE-08
For the first 11 points:
SDSGM (i) = fcd_j*[1-(1-SDEPS(i) / EPSint)n]
n = 2; fck £ 50 MPa
n =1.4 + 9.6 * [(100-fck)/100]4; fck > 50 MPa
For point 12:
SDSGM (i) = fcd_j
3.4.15.6.2 Definition of the bilinear stress-strain diagram (TSDSSD = 2):
Number of diagram points
NPSDSSD = 3
The sign criterion for the definition of points of the stress-strain diagram is as follows:
+Tension, -Compression
Strain point values conform to article Art. 39.5 a) and are the following:
|
SDEPS (1) |
= |
- EPSmin |
|
SDEPS (2) |
= |
- EPSint |
|
SDEPS (3) |
= |
0.000 |
The corresponding stress points are the following:
EHE-98
|
SDSGM (1) |
= |
-0.85*fcd_j |
|
SDSGM (2) |
= |
-0.85*fcd_j |
|
SDSGM (3) |
= |
0.00 |
EHE-08
|
SDSGM (1) |
= |
-fcd_j |
|
SDSGM (2) |
= |
-fcd_j |
|
SDSGM (3) |
= |
0.00 |
3.4.15.6.3 Definition of the rectangular stress-strain diagram (TSDSSD = 3):
Number of diagram points:
NPSDSSD = 0
Specific points for rectangular diagrams are not defined because stresses do not depend on strains, but on the distance between the outer most compressed fiber and the neutral axis.
3.4.16 EHE (Reinforcement Steel)
For this type of material (Type = 3) the following properties, according to EHE are described hereafter:
3.4.16.1 Safety Factors
|
GAMs |
Steel safety factor (Art. 15.3) gs = 1.15 |
3.4.16.2 Mechanical Properties
|
fyk |
Characteristic yield stress (Art. 31.1 & Art. 38.2) of the EHE code. |
|
fyd |
Design tensile strength Art. 38.3 (+ Tension) fyd = fyk/GAMs |
|
fycd |
Design compressive strength. This value has been taken from article (Art. 40.2) (+ Compression) fycd = Min (fyd, 400 Mpa) |
|
fmax |
Characteristic tensile strength. This value has been taken from article (Art. 38.2) (+ Tension) fmax = 1.05*fyk |
|
EPSmax |
Characteristic elongation at maximum load (Art. 38.2) (EPSuk ³ 0) |
3.4.16.3 Stress-Strain Diagram for Structural Analysis
The different types of stress-strain diagrams available for reinforcement steel, according to EHE code are the following:
|
TSASSD= 0 |
User defined |
|
TSASSD= 1 |
Elastic |
|
TSASSD= 2 |
Bilinear |
3.4.16.3.1 Definition of the elastic diagram (TSASSD = 1):
Number of diagram points
NPSASSD = 4
The sign criterion for the definition of points of the stress-strain diagram is as follows:
+Tension, -Compression
Strain point values are the following:
|
SAEPS (1) |
= |
-0.010 |
|
SAEPS (2) |
= |
0.010 |
The corresponding stress values are:
|
SASGM (1) |
= |
SAEPS(1)*Ex |
|
SASGM (2) |
= |
SAEPS(2)*Ex |
3.4.16.3.2 Definition of the bilinear diagram (TSASSD = 2):
Number of diagram points
NPSASSD = 4
The sign criterion for the definition of points of the stress-strain diagram is as follows:
+Tension, -Compression
Strain point values conform to article Art. 21.3.3 and are the following:
|
SAEPS (1) |
= |
-EPSmax |
|
SAEPS (2) |
= |
-fyk/Ex |
|
SAEPS (3) |
= |
fyk/Ex |
|
SAEPS (4) |
= |
EPSmax |
The corresponding stress values are:
|
SASGM (1) |
= |
-fmax |
|
SASGM (2) |
= |
-fyk |
|
SASGM (3) |
= |
fyk |
|
SASGM (4) |
= |
fmax |
3.4.16.4 Stress-Strain Diagrams for Section Analysis
The different types of stress-strain diagrams available for reinforcement steel, according to EHE code are the following:
|
TSDSSD= 0: |
User defined |
|
TSDSSD= 1: |
Bilinear with horizontal top branch |
|
TSDSSD= 2: |
Bilinear with inclined top branch |
3.4.16.4.1 Definition of the bilinear with horizontal top branch stress-strain diagram (TSDSSD = 1):
Number of diagram points
NPSDSSD = 4
The sign criterion for the definition of points of the stress-strain diagram is as follows:
+Tension, -Compression
Strain point values conform to article Art. 38.4 and are the following:
|
SDEPS (1) |
= |
-0.010 |
|
SDEPS (2) |
= |
-fyd/Ex |
|
SDEPS (3) |
= |
fyd/Ex |
|
SDEPS (4) |
= |
0.010 |
The corresponding stress values are:
|
SDSGM (1) |
= |
-fyd |
|
SDSGM (2) |
= |
-fyd |
|
SDSGM (3) |
= |
fyd |
|
SDSGM (4) |
= |
fyd |
3.4.16.4.2 Definition of the bilinear with sloping top branch stress-strain diagram (TSDSSD = 2):
Number of diagram points
NPSDSSD = 4
The sign criterion for the definition of points of the stress-strain diagram is as follows:
+Tension, -Compression
Strain point values conform to article Art. 38.4 and are the following:
|
SDEPS (1) |
= |
-0.010 |
|
SDEPS (2) |
= |
-fyd/Ex |
|
SDEPS (3) |
= |
fyd/Ex |
|
SDEPS (4) |
= |
0.010 |
The corresponding stress values are:
|
SDSGM (1) |
= |
-fyd-(0.0035-fyd/Ex)*(fmax-fyk)/(EPSmax-fyk/Ex) |
|
SDSGM (2) |
= |
-fyd |
|
SDSGM (3) |
= |
fyd |
|
SDSGM (4) |
= |
fyd+(0.010-fyd/Ex)*(fmax-fyk)/(EPSmax-fyk/Ex) |
3.4.17 EHE (Prestressing steel)
For this type of material (Type = 4) the following properties, according to EHE are described hereafter:
3.4.17.1 Safety Factor
|
GAMs |
Safety factor (Art. 15.3) GAMs ³ 0 |
3.4.17.2 Mechanical Properties
|
fmax |
Characteristic tensile strength (Art.32.2) fmax ³ 0 |
|
fpk |
Characterisitc yield stress (Art. 38.6). fpk ³ 0 |
|
fyd |
Design tensile strength (Art. 38.6) (+Tension) fpd = fpk/GAMs |
|
EPSmax |
Total elongation due to the maximum load (Art. 38.2) (EPSuk ³ 0) |
3.4.17.3 Relaxation
|
AgeR1 |
Relaxation age 1 (hours). |
|
AgeR1 |
Relaxation age 2 (hours). |
|
Ro1_60 |
Relaxation for AgeR1 and 60%fmax |
|
Ro1_70 |
Relaxation for AgeR1 and 70%fmax |
|
Ro1_80 |
Relaxation for AgeR1 and 80%fmax |
|
Ro2_60 |
Relaxation for AgeR2 and 60%fmax |
|
Ro2_70 |
Relaxation for AgeR2 and 70%fmax |
|
Ro2_80 |
Relaxation for AgeR2 and 80%fmax |
3.4.17.4 Stress-Strain Diagram for Structural Analysis
The different types of stress-strain diagrams available for prestressing steel, according to EHE code are the following:
|
TSASSD= 0 |
User-defined |
|
TSASSD= 1 |
Elastic |
|
TSASSD= 2 |
Bilinear |
|
TSASSD= 3 |
Characteristic diagram |
3.4.17.4.1 Definition of the elastic diagram (TSASSD = 1):
Number of diagram points
NPSASSD = 4
The sign criterion for the definition of points of the stress-strain diagram is as follows:
+Tension, -Compression
Strain point values are the following:
|
SAEPS (1) |
= |
-1.0E-2 |
|
SAEPS (2) |
= |
1.0E+2 |
The corresponding stress values are:
|
SASGM (1) |
= |
SAEPS(1)*Ex |
|
SASGM (2) |
= |
SAEPS(2)*Ex |
3.4.17.4.2 Definition of the bilinear diagram (TSASSD = 2):
Number of diagram points
NPSASSD = 4
The sign criterion for the definition of points of the stress-strain diagram is as follows:
+Tension, -Compression
Strain point values are the following:
|
SAEPS (1) |
= |
-0.823·(Fmax/fpk-0.7)5+Fmax/Ex) |
|
SAEPS (2) |
= |
-fpk/Ex |
|
SAEPS (3) |
= |
fpk/Ex |
|
SAEPS (4) |
= |
0.823·(Fmax/fpk-0.7)5+Fmax/Ex) |
The corresponding stress values are:
|
SASGM (1) |
= |
-fpk+(SAEPS(1)-SAEPS(2))/PLRAT·Ex |
|
SASGM (2) |
= |
-fpk |
|
SASGM (3) |
= |
fpk |
|
SASGM (4) |
= |
fpk+(SAEPS(1)-SAEPS(2))/PLRAT·Ex |
3.4.17.4.3 Definition of the characteristic diagram (TSASSD = 3):
Number of diagram points
NPSASSD = 20
The sign criterion for the definition of points of the stress-strain diagram is as follows:
+Tension, -Compression
Strain point values conform to article Art. 38.5 and are the following:
SAEPS (1) = 0.0
SAEPS (2) = 0.7*fpk/Ex
For the points 3 to 20:
SAEPS (i) = 0.823*(SASGM(i) / fpk-0.7)^5+ SASGM(i) / Ex
The corresponding stress points are the following:
|
SASGM (1) |
= |
0.0 |
|
SASGM (2) |
= |
0.7*fpk |
|
SASGM (3) |
= |
0.10*(Fmax-0.7*fpk)+0.7*fpk |
|
SASGM (4) |
= |
0.20*(Fmax-0.7*fpk)+0.7*fpk |
|
SASGM (5) |
= |
0.25*(Fmax-0.7*fpk)+0.7*fpk |
|
SASGM (6) |
= |
0.30*(Fmax-0.7*fpk)+0.7*fpk |
|
SASGM (7) |
= |
0.35*(Fmax-0.7*fpk)+0.7*fpk |
|
SASGM (8) |
= |
0.40*(Fmax-0.7*fpk)+0.7*fpk |
|
SASGM (9) |
= |
0.45*(Fmax-0.7*fpk)+0.7*fpk |
|
SASGM (10) |
= |
0.50*(Fmax-0.7*fpk)+0.7*fpk |
|
SASGM (11) |
= |
0.55*(Fmax-0.7*fpk)+0.7*fpk |
|
SASGM (12) |
= |
0.60*(Fmax-0.7*fpk)+0.7*fpk |
|
SASGM (13) |
= |
0.65*(Fmax-0.7*fpk)+0.7*fpk |
|
SASGM (14) |
= |
0.70*(Fmax-0.7*fpk)+0.7*fpk |
|
SASGM (15) |
= |
0.75*(Fmax-0.7*fpk)+0.7*fpk |
|
SASGM (16) |
= |
0.80*(Fmax-0.7*fpk)+0.7*fpk |
|
SASGM (17) |
= |
0.85*(Fmax-0.7*fpk)+0.7*fpk |
|
SASGM (18) |
= |
0.90*(Fmax-0.7*fpk)+0.7*fpk |
|
SASGM (19) |
= |
0.95*(Fmax-0.7*fpk)+0.7*fpk |
|
SASGM (20) |
= |
1.00*(Fmax-0.7*fpk)+0.7*fpk |
3.4.17.5 Stress-Strain Diagrams for Section Analysis
The different types of stress-strain diagrams available for prestressing steel, according to EHE code are the following:
|
TSDSSD= 0 |
User-defined |
|
TSDSSD= 1 |
Design diagram |
3.4.17.5.1 Definition of the design diagram (TSDSSD = 1):
Number of diagram points
NPSDSSD = 20
The sign criterion for the definition of points of the stress-strain diagram is as follows:
+Tension, -Compression
Strain point values conform to article Art. 38.6 and are the following:
SDEPS (1) = 0.0
SDEPS (2) = 0.7*fpk/Ex/GAMs
For the points 3 to 20:
SDEPS(i) = 0.823*(SASGM(i) / fpk*GAMs-0.7)^5+ SASGM(i) / Ex
The corresponding stress points are the following:
|
SDSGM (1) |
= |
0.0 |
|
SDSGM (2) |
= |
0.7*fpk/GAMs |
|
SDSGM (3) |
= |
0.10*(Fmax-0.7*fpk/GAMs)+0.7*fpk/GAMs |
|
SDSGM (4) |
= |
0.20*(Fmax-0.7*fpk/GAMs)+0.7*fpk/GAMs |
|
SDSGM (5) |
= |
0.25*(Fmax-0.7*fpk/GAMs)+0.7*fpk/GAMs |
|
SDSGM (6) |
= |
0.30*(Fmax-0.7*fpk/GAMs)+0.7*fpk/GAMs |
|
SDSGM (7) |
= |
0.35*(Fmax-0.7*fpk/GAMs)+0.7*fpk/GAMs |
|
SDSGM (8) |
= |
0.40*(Fmax-0.7*fpk/GAMs)+0.7*fpk/GAMs |
|
SDSGM (9) |
= |
0.45*(Fmax-0.7*fpk/GAMs)+0.7*fpk/GAMs |
|
SDSGM (10) |
= |
0.50*(Fmax-0.7*fpk/GAMs)+0.7*fpk/GAMs |
|
SDSGM (11) |
= |
0.55*(Fmax-0.7*fpk/GAMs)+0.7*fpk/GAMs |
|
SDSGM (12) |
= |
0.60*(Fmax-0.7*fpk/GAMs)+0.7*fpk/GAMs |
|
SDSGM (13) |
= |
0.65*(Fmax-0.7*fpk/GAMs)+0.7*fpk/GAMs |
|
SDSGM (14) |
= |
0.70*(Fmax-0.7*fpk/GAMs)+0.7*fpk/GAMs |
|
SDSGM (15) |
= |
0.75*(Fmax-0.7*fpk/GAMs)+0.7*fpk/GAMs |
|
SDSGM (16) |
= |
0.80*(Fmax-0.7*fpk/GAMs)+0.7*fpk/GAMs |
|
SDSGM (17) |
= |
0.85*(Fmax-0.7*fpk/GAMs)+0.7*fpk/GAMs |
|
SDSGM (18) |
= |
0.90*(Fmax-0.7*fpk/GAMs)+0.7*fpk/GAMs |
|
SDSGM (19) |
= |
0.95*(Fmax-0.7*fpk/GAMs)+0.7*fpk/GAMs |
|
SDSGM (20) |
= |
1.00*(Fmax-0.7*fpk/GAMs)+0.7*fpk/GAMs |
3.4.18 BS8110 (Concrete)
For this type of material (Type = 2) the following properties are defined:
3.4.18.1 Type of Cement and Curing
|
CeTp |
Type of cement
|
3.4.18.2 Safety Factors
|
GAMc |
Safety factor for concrete. Table 2.2. BS 8110: Part 1: 1997 GAMc ≥ 1 |
3.4.18.3 Mechanical Properties
|
fcu |
Specified concrete compressive strength at 28 days (+ Compression) Art 2421. BS 8110: Part 1: 1997 . fcu ≥ 0 |
||||||||
|
EPSc1 |
Strain
in concrete at maximum stress. BS8110: Part 2: Figure 2.1 |
||||||||
|
EPScu |
Ultimate strain in compression. (- Compression). EPScu ≤ 0 |
||||||||
|
s |
Coefficient which depends on the type of cement concerned. Taken from CEB-FIP code, article 2.1.6.1
|
3.4.18.4 Time Dependent Mechanical Properties
|
BETcc(Age) |
Coefficient which depends on concrete age. BETcc = exp {s*[1-(28/Age)1/2]} (Age is expressed in days.) |
|
fcu_t (Age) |
Characteristic t-day compressive strength BS 8110: Part2 Table 7.1 (+ Compression). fcu_t ≥ 0 fcu_t=BETcc*fcu |
|
Ko |
Constant that is closely related to the modulus of elasticity of the aggregate. BS 8110: Part 2: Art 7.2 Ko ≥ 0 |
|
Ec28 |
Modulus of elasticity at 28 days. BS 8110: Part 2: Art 7.2 Ec28 ≥ 0 Ec28=Ko+0.2*fcu*1000 |
|
Ec_t (Age) |
Modulus of elasticity. BS 8110: Part 2: Art 7.2 Ec_t ≥ 0 Ec_t=Ec28*(0.4+0.6*fcu_t/fcu) |
3.4.18.5 Stress-strain Diagrams for Structural Analysis
The different types of stress-strain diagrams available for concrete, according to the BS8110 code are the following:
|
TSASSD= 0: |
User defined |
|
TSASSD= 1: |
Elastic |
|
TSASSD= 2: |
Structural analysis |
3.4.18.5.1 Definition of the elastic stress-strain diagram (TSASSD = 1):
The sign criterion for the definition of stress-strain diagram points is as follows:
+Tension, -Compression
A total of 2 points (NPSASSD = 2) has been chosen for the definition of the stress-strain diagram. Strain values are the following:
|
SAEPS (1) |
= |
-10-2 |
|
SAEPS (2) |
= |
10-2 |
For these points, stress values are the following:
|
SASGM (i) = SAEPS (i) * Ex |
3.4.18.5.2 Definition of the Structural analysis stress-strain diagram (TSASSD = 2):
Number of diagram points
NPSASSD = 20
The sign criterion for the definition of points of the stress-strain diagram is as follows:
+Tension, -Compression
Strain points are in accordance with notes expressed in BS8110 Part 2 Fig,2.1 and are the following:
|
SAEPS (1) |
= |
1.000*(EPScu-EPSc1)+EPSc1 |
|
SAEPS (2) |
= |
0.793*(EPScu-EPSc1)+EPSc1 |
|
SAEPS (3) |
= |
0.617*(EPScu-EPSc1)+EPSc1 |
|
SAEPS (4) |
= |
0.468*(EPScu-EPSc1)+EPSc1 |
|
SAEPS (5) |
= |
0.342*(EPScu-EPSc1)+EPSc1 |
|
SAEPS (6) |
= |
0.234*(EPScu-EPSc1)+EPSc1 |
|
SAEPS (7) |
= |
0.143*(EPScu-EPSc1)+EPSc1 |
|
SAEPS (8) |
= |
0.066*(EPScu-EPSc1)+EPSc1 |
|
SAEPS (9) |
= |
1.000*EPSc1 |
|
SAEPS (10) |
= |
0.964*EPSc1 |
|
SAEPS (11) |
= |
0.922*EPSc1 |
|
SAEPS (12) |
= |
0.873*EPSc1 |
|
SAEPS (13) |
= |
0.816*EPSc1 |
|
SAEPS (14) |
= |
0.749*EPSc1 |
|
SAEPS (15) |
= |
0.669*EPSc1 |
|
SAEPS (16) |
= |
0.575*EPSc1 |
|
SAEPS (17) |
= |
0.465*EPSc1 |
|
SAEPS (18) |
= |
0.335*EPSc1 |
|
SAEPS (19) |
= |
0.181*EPSc1 |
|
SAEPS (20) |
= |
0.000*EPSc1 |
The corresponding stress points are the following:
SASGM(i)= -[(k*Eta(i)-Eta(i)^2)/(1+(k-2)*Eta)]*0.8*fcu_t
Where:
K = 1.4*Ec_t*EPSc1/(-fcu_t)
Eta(i) = -SAEPS(i)/EPSc1
3.4.18.6 Stress-Strain Diagrams for Section Analysis
The different types of stress-strain diagrams available for concrete, according to the ACI code are the following:
|
TSDSSD= 0: |
User defined |
|
TSDSSD= 1: |
Parabolic rectangular |
|
TSDSSD= 2: |
Rectangular |
3.4.18.6.1 Definition of the Parabolic rectangular diagram (TSDSSD = 1):
Number of diagram points
NPSDSSD = 12
The sign criterion for the definition of points of the stress-strain diagram is as follows:
+Tension, -Compression
Strain points are in accordance with notes expressed in BS 8110: Part 1. Figure 2.1 and are the following:
|
SDEPS (1) |
= |
-0.0035 |
|
SDEPS (2) |
= |
-2.4E-4*(fcu_t/GAMc)^(1/2) |
|
SDEPS (3) |
= |
-0.9*2.4E-4*(fcu_t/GAMc)^(1/2) |
|
SDEPS (4) |
= |
-0.8*2.4E-4*(fcu_t/GAMc)^(1/2) |
|
SDEPS (5) |
= |
-0.7*2.4E-4*(fcu_t/GAMc)^(1/2) |
|
SDEPS (6) |
= |
-0.6*2.4E-4*(fcu_t/GAMc)^(1/2) |
|
SDEPS (7) |
= |
-0.5*2.4E-4*(fcu_t/GAMc)^(1/2) |
|
SDEPS (8) |
= |
-0.4*2.4E-4*(fcu_t/GAMc)^(1/2) |
|
SDEPS (9) |
= |
-0.3*2.4E-4*(fcu_t/GAMc)^(1/2) |
|
SDEPS (10) |
= |
-0.2*2.4E-4*(fcu_t/GAMc)^(1/2) |
|
SDEPS (11) |
= |
-0.1*2.4E-4*(fcu_t/GAMc)^(1/2) |
|
SDEPS (12) |
= |
0.000 |
The corresponding stress points are the following:
For points 2 to 12:
SDSGM(i)=(-0.67E8/2.4/2.4)*SDEPS(i) ^2+(0.67E4/1.2)*(fcu_t/GAMc)^(1/2)*SDEPS(i)
For point 1:
SDSGM(i) = 0.67*fcu_t / GAMc
3.4.18.6.2 Definition of the rectangular diagram (TSDSSD = 2):
Number of diagrams points
NPSDSSD = 0
Specific points for rectangular diagrams are not defined because stresses do not depend on strains, but on the distance between the outer most compressed fiber and the neutral axis.
3.4.19 BS8110 (Reinforcement steel)
For this type of material (Type = 3) the following properties are considered:
3.4.19.1 Safety Factor
|
GAMs |
Safety factor for steel. BS 8110: Part 1: Table 2.2 GAMs ≥ 1 |
3.4.19.2 Mechanical Properties
|
fy |
Yield strength. BS 8110: Part 1: Table 3.1 fy ≥ 0 |
|
Rm |
Characteristic tensile strength. BS 4449: Table 7 (+ Tension) Rm ≥ 0 |
|
A5 |
Elongation at fracture. BS 4449: Table 7 (+ Tension) A5 ≥ 0 |
3.4.19.3 Stress-Strain Diagrams for Structural Analysis
The different types of stress-strain diagrams available for reinforcement steel, according to BS8110 code are the following:
|
TSASSD= 0 |
User defined |
|
TSASSD= 1 |
Elastic |
|
TSASSD= 2 |
Bilinear |
3.4.19.3.1 Definition of the bilinear diagram (TSASSD = 1):
Number of diagram points
NPSASSD = 2
The sign criterion for the definition of points of the stress-strain diagram is as follows:
+Tension, -Compression
Strain values for the stress-strain diagram have been taken as:
|
SAEPS (1) |
= |
-1.0E-2 |
|
SAEPS (2) |
= |
1.0E+2 |
The corresponding stress values are:
|
SASGM (1) |
= |
SAEPS(1)*ExLn |
|
SASGM (2) |
= |
SAEPS(2)*ExLn |
3.4.19.3.2 Definition of the bilinear diagram (TSASSD = 2):
Number of diagram points
NPSASSD = 4
The sign criterion for the definition of points of the stress-strain diagram is as follows:
+Tension, -Compression
Strain values for the stress-strain diagram have been taken as:
|
SAEPS (1) |
= |
-0.01 |
|
SAEPS (2) |
= |
-fy/Ex |
|
SAEPS (3) |
= |
fy/Ex |
|
SAEPS (4) |
= |
0.01 |
The corresponding stress values are:
|
SASGM (1) |
= |
-fy |
|
SASGM (2) |
= |
-fy |
|
SASGM (3) |
= |
fy |
|
SASGM (4) |
= |
fy |
3.4.19.4 Stress-Strain Diagram for Section Analysis
The different types of stress-strain diagrams available for reinforcement steel, according to BS8110 code are the following:
|
TSDSSD= 0 |
User defined |
|
TSDSSD= 1 |
Bilinear |
3.4.19.4.1 Definition of the bilinear diagram (TSDSSD = 1):
Number of diagrams points
NPSDSSD = 4
The sign criterion for the definition of points of the stress-strain diagram is as follows:
+Tension, -Compression
Strain values for the stress-strain diagram have been taken as:
|
SDEPS (1) |
= |
-0.01 |
|
SDEPS (2) |
= |
-fy/GAMs/Ex |
|
SDEPS (3) |
= |
fy/ GAMs/Ex |
|
SDEPS (4) |
= |
0.01 |
The corresponding stress values are:
|
SDSGM (1) |
= |
-fy/GAMs |
|
SDSGM (2) |
= |
-fy/GAMs |
|
SDSGM (3) |
= |
fy/GAMs |
|
SDSGM (4) |
= |
fy/GAMs |
3.4.20 GB50010 (Concrete)
For this type of material (Type = 2) the following properties are defined:
3.4.20.1 Type of Cement and Curing
|
CeTp |
Type of cement
|
3.4.20.2 Safety factors
|
GAMc |
Safety factor for concrete. GAMc ≥ 1 Art. 1.6.4.4 |
3.4.20.3 Mechanical properties
|
fcuk |
Specified concrete compressive strength at 28 days Art 4.1.1 (+Compression). fcu ≥ 0 |
||||||||||||||||||||||
|
ALPC1 |
Prism strength and cube strength ratio.
These values are obtained from the following formula: ALPC1=0.76 + 0.06*(fcuk - 50.0)/30.0 (- Compression) 0.76 ≤ ALPc1 ≤ 0.821 |
||||||||||||||||||||||
|
ALPC2 |
Brittle reduction coefficient.
These values are obtained from the following formula: ALPC2=1 - 0.13*(fcuk - 40.0)/40.0 (- Compression) 0.87 ≤ ALPc2 ≤ 1 |
||||||||||||||||||||||
|
DELTA |
Variation coefficient (Table 4.1.3).
|
||||||||||||||||||||||
|
FCK |
Standard axial compressive strength. fck=0.88*ALPc1*ALPc2*fcuk |
||||||||||||||||||||||
|
FC |
Design value for axial compressive strength (Art. 4.1.3) (+Compression fck≥0).
|
||||||||||||||||||||||
|
FTK |
Standard tensile strength (Art. 4.1.4) (+Tension ftk>0). ftk =0.88*0.395*(fcuk**0.55)*(1-1.645*delta)**0.45*ALPc2 |
||||||||||||||||||||||
|
FT |
Design value for tensile strength (Art. 2.1.3) (+Compression ft>0): fcd = ftk/GAMc |
||||||||||||||||||||||
|
S |
Coefficient which depends on the type of cement (0<s<1):
|
||||||||||||||||||||||
|
n |
Exponent of the stress strain diagram Art. 7.1.2-3. n=2-(fcuk-50)/60 [MPa] |
||||||||||||||||||||||
|
EPS0 |
Compressive strain at Fc Art. 7.1.2-4: EPS0 = 0.002+0.5*(fcuk-50)*10E-5 [MPa] |
||||||||||||||||||||||
|
EPSCu |
Limit compressive strain in concrete in Art. 7.1.2-5: EPScu = 0.0033-(fcuk-50)*10E-5 [MPa] |
3.4.20.4 Time Dependent Mechanical Properties
|
BETcc(Age) |
Coefficient which depends on concrete age. The age index must be specified in IDX1. BETcc=*exp{s*[1-(28/Age)^1/2]} (Age is expressed in days.) |
|
Fck_t(Age) |
Standard t day compressive strength. The age index must be specified in IDX1. fck_t=BETcc*fck |
|
Fc_t(Age) |
Design t day compressive strength. The age index must be specified in IDX1. fc_t=fck_t/GAMc |
|
Ec_t(Age) |
Modulus of elasticity. The age index must be specified in IDX1. Ec=1.D5/(2.2D0+34.7D0/Fcuk/BETcc) [MPa] |
3.4.20.5 Stress-Strain Diagrams for Structural Analysis
The different types of stress-strain diagrams available for concrete, according to GB50010 code are the following:
|
TSASSD= 0 |
User defined |
|
TSASSD= 1 |
Elastic |
|
TSASSD= 2 |
Structural analysis |
3.4.20.5.1 Definition of the elastic stress-strain diagram (TSASSD = 1):
The sign criterion for the definition of stress-strain diagram points is as follows:
+Tension, -Compression
A total of 2 points (NPSASSD = 2) has been chosen for the definition of the stress-strain diagram. Strain values are the following:
|
SAEPS (1) |
= |
-10-2 |
|
SAEPS (2) |
= |
10-2 |
For these points, stress values are the following:
|
SASGM (i) = SAEPS (i) * Ex |
3.4.20.5.2 Definition of the Structural analysis stress-strain diagram (TSASSD = 2):
Number of diagram points
NPSASSD = 20
The sign criterion for the definition of points of the stress-strain diagram is as follows:
+Tension, -Compression
Strain points are in accordance with notes expressed in GB50010 and are the following:
|
SAEPS (1) |
= |
1.000*(EPSu-EPSc)+EPSc |
|
SAEPS (2) |
= |
0.793*(EPSu-EPSc)+EPSc |
|
SAEPS (3) |
= |
0.617*(EPSu-EPSc)+EPSc |
|
SAEPS (4) |
= |
0.468*(EPSu-EPSc)+EPSc |
|
SAEPS (5) |
= |
0.342*(EPSu-EPSc)+EPSc |
|
SAEPS (6) |
= |
0.234*(EPSu-EPSc)+EPSc |
|
SAEPS (7) |
= |
0.143*(EPSu-EPSc)+EPSc |
|
SAEPS (8) |
= |
0.066*(EPSu-EPSc)+EPSc |
|
SAEPS (9) |
= |
1.000*EPSc |
|
SAEPS (10) |
= |
0.964*EPSc |
|
SAEPS (11) |
= |
0.922*EPSc |
|
SAEPS (12) |
= |
0.873*EPSc |
|
SAEPS (13) |
= |
0.816*EPSc |
|
SAEPS (14) |
= |
0.749*EPSc |
|
SAEPS (15) |
= |
0.669*EPSc |
|
SAEPS (16) |
= |
0.575*EPSc |
|
SAEPS (17) |
= |
0.465*EPSc |
|
SAEPS (18) |
= |
0.335*EPSc |
|
SAEPS (19) |
= |
0.181*EPSc |
|
SAEPS (20) |
= |
0.000
|


The corresponding stress points for GB50010-2002 are the following:
If 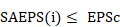

Otherwise:
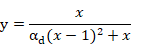
where:




and the corresponding stress points for GB50010-2010 are the following:
If
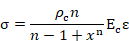
Otherwise:
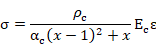
where


 = SAEPS(i)

 : Ec_t
 : fck_t(i)
3.4.20.6 Stress-strain Diagrams for Section Analysis
The different types of stress-strain diagrams available for concrete, according to GB50010 code are the following:
|
TSDSSD= 0: |
User defined |
|
TSDSSD= 1: |
Parabolic rectangular |
3.4.20.6.1 Definition of the Parabolic rectangular diagram (TSDSSD = 1):
Number of diagram points
NPSDSSD = 12
The sign criterion for the definition of points of the stress-strain diagram is as follows:
+Tension, -Compression
Strain points have been taken according to notes expressed in GB50010 and are the following:
|
SDEPS (1) |
= |
-EPScu |
|
SDEPS (2) |
= |
-1.0D0*EPS0 |
|
SDEPS (3) |
= |
-0.9D0*EPS0 |
|
SDEPS (4) |
= |
-0.8D0*EPS0 |
|
SDEPS (5) |
= |
-0.7D0*EPS0 |
|
SDEPS (6) |
= |
-0.6D0*EPS0 |
|
SDEPS (7) |
= |
-0.5D0*EPS0 |
|
SDEPS (8) |
= |
-0.4D0*EPS0 |
|
SDEPS (9) |
= |
-0.3D0*EPS0 |
|
SDEPS (10) |
= |
-0.2D0*EPS0 |
|
SDEPS (11) |
= |
-0.1D0*EPS0 |
|
SDEPS (12) |
= |
0.0D0 |
The corresponding stress points are the following:
For points 3 to 12:
SDSGM(i) =1.D0-(1.D0+ SDEPS(i)/EPS0)**n)*fc_t(i)
For point 1:
SDSGM(1) = -fc_t
For point 2:
SDSGM(2) = -fc_t
3.4.21 GB50010 (Reinforcement steel)
For this type of material (Type = 3) the following properties are considered:
3.4.21.1 Safety factor
|
GAMs |
GAMs ≥ 1 |
3.4.21.2 Mechanical properties
|
fyk |
Characteristic yield strength; fyk ≥ 0 |
|
|
fy |
Yield strength. (+ Tension) fy = fyk/GAMs |
|
|
fstk |
Characteristic tensile strength |
|
EPSmax Characteristic elongation at maximum load
3.4.21.3 Stress-strain Diagrams for Structural Analysis
The different types of stress-strain diagrams available for reinforcement steel, according to GB50010 code are the following:
|
TSASSD= 0 |
User defined |
|
TSASSD= 1 |
Elastic |
|
TSASSD= 2 |
Bilinear |
3.4.21.3.1 Definition of the elastic diagram (TSASSD = 1):
Number of diagram points
NPSASSD = 2
The sign criterion for the definition of points of the stress-strain diagram is as follows:
+Tension, -Compression
Strain values for the stress-strain diagram have been taken as:
|
SAEPS (1) |
= |
-1.0E-2 |
|
SAEPS (2) |
= |
1.0E-2 |
The corresponding stress values are:
|
SASGM (1) |
= |
SAEPS(1)*Ex |
|
SASGM (2) |
= |
SAEPS(2)*Ex |
3.4.21.3.2 Definition of the bilinear diagram (TSASSD = 2):
Number of diagram points:
NPSASSD = 4
The sign criterion for the definition of points of the stress-strain diagram is as follows:
+Tension, -Compression
GB50010-2002
Strain values for the stress-strain diagram have been taken as:
|
SAEPS (1) |
= |
-0.01 |
|
SAEPS (2) |
= |
-fyk/Ex |
|
SAEPS (3) |
= |
fyk/Ex |
|
SAEPS (4) |
= |
0.01
|
The corresponding stress values are:
|
SASGM (1) |
= |
-fyk |
|
SASGM (2) |
= |
-fyk |
|
SASGM (3) |
= |
fyk |
|
SASGM (4) |
= |
fyk |
GB50010-2010
Strain values for the stress-strain diagram have been taken as:
|
SAEPS (1) |
= |
-EPSmax |
|
SAEPS (2) |
= |
-fyk/Ex |
|
SAEPS (3) |
= |
fyk/Ex |
|
SAEPS (4) |
= |
EPSmax |
The corresponding stress values are:
|
SASGM (1) |
= |
-fstk |
|
SASGM (2) |
= |
-fyk |
|
SASGM (3) |
= |
fyk |
|
SASGM (4) |
= |
fstk |
3.4.21.4 Stress-Strain Diagram for Section Analysis
The different types of stress-strain diagrams available for reinforcement steel, according to GB50010 code are the following:
|
TSDSSD= 0: |
User defined |
|
TSDSSD= 1: |
Bilinear |
3.4.21.4.1 Definition of the bilinear diagram (TSDSSD = 1):
Number of diagrams points
NPSDSSD = 4
The sign criterion for the definition of points of the stress-strain diagram is as follows:
+Tension, -Compression
Strain values for the stress-strain diagram have been taken as:
|
SDEPS (1) |
= |
-0.01 |
|
SDEPS (2) |
= |
-fy/Ex |
|
SDEPS (3) |
= |
fy/Ex |
|
SDEPS (4) |
= |
0.01
|
The corresponding stress values are:
|
SDSGM (1) |
= |
-fy |
|
SDSGM (2) |
= |
-fy |
|
SDSGM (3) |
= |
fy |
|
SDSGM (4) |
= |
fy |
3.4.22 AS3600
CivilFEM does not contain the material data conforming to Australian Standard AS3600. If this code is activated, the selected material (concrete or reinforcement steel) will be filled out with the same parameters as the ACI-318 code requires.
3.4.23 NBR6118 (Concrete)
For this type of material (Type = 2) the following properties are considered:
3.4.23.1 Type of Cement
|
CeTp |
Refers to the different types of cement used. These types are described in the Appendix A article A.2.4 and are the following:
|
3.4.23.2 Partial Safety Factors
|
GAMc |
Partial safety factor for concrete (Art. 12.4.1 GAMc ³ 1) gc=1.5 (Default value) |
3.4.23.3 Mechanical Properties
|
fck |
Concrete characteristic 28-day compressive strength (Art. 8.2.4) (+Compression fck ³ 0) |
||||||||||
|
fcm |
Mean 28-day compressive strength (Art. 6.4.3) (+ Compression) fcm³0 fcm = fck + 1.65*Sd |
||||||||||
|
fcd |
Design 28-day compressive strength (Art. 12.3.3) (+Compression) fcd = fck/GAMc |
||||||||||
|
fctm |
Mean tensile strength (Art. 8.2.5) (+ Tension) fctm = 0.3*(fck2/3) (fctm and fctk in MPa) |
||||||||||
|
fctk_inf |
Lower characteristic tensile strength (Art. 8.2.5) (+Tension) fctk_inf = 0.21*(fck2/3) (fctk and fctk_inf in MPa) |
||||||||||
|
fctk_sup |
Upper characteristic tensile strength (Art. 8.2.5) (+Tension) fctk_inf = 0.39*(fck2/3) (fctk and fctk_sup in MPa) |
||||||||||
|
Sd |
Standard deviation (Art. 6.4.3) (Sd > 0) Sd = 4 MPa (default value) |
||||||||||
|
s |
Coefficient which depends on the type of cement. (Art. 12.3.3)
|
3.4.23.4 Time Dependent Mechanical Properties
|
BETcc |
Coefficient which depends on concrete age. (Art. 12. 3. 3) BETcc = exp {s*[1-(28/Age)1/2]} (Age is expressed in days) |
|
fcm_t(Age) |
Mean compressive strength. (+ Compression) (Art. 6.4.3) fcm_t = fck_t+1.65*Sd |
|
fck_t(Age) |
Characteristic t day compressive strength. (+ Compression) (Art. 8.2.4) fck_t = fck * BET1 |
|
fcd_t(Age) |
Design t day compressive strength (Art. 12.3.3) (+Compression) If Age < 28 days fcd_t = fck_t/GAMc If Age ³ 28 days fcd_t = fck/GAMc |
|
Eci(Age) |
Initual modulus of elasticity (Art. 8.2.8). Eci = 5600 * (fck_t)1/2 |
|
Ecm(Age) |
Secant modulus of elasticity (Art. 8.2.8). Ecm = 0.85 * Eci |
3.4.23.5 Stress-strain Diagrams for Structural Analysis
The different type of stress-strain concrete diagrams available according to NBR6118 are:
|
TSASSD= 0: |
User defined |
|
TSASSD= 1: |
Elastic |
3.4.23.5.1 Definition of the elastic stress-strain diagram (TSASSD = 1):
The sign criterion for the definition of stress-strain diagram points is as follows:
+Tension, -Compression
A total of 2 points (NPSASSD = 2) has been chosen for the definition of the stress-strain diagram. Strain values are the following:
|
SAEPS (1) |
= |
-10-2 |
|
SAEPS (2) |
= |
10-2 |
For these points, stress values are the following:
|
SASGM (i) = SAEPS (i) * Ex |
3.4.23.6 Stress-Strain Diagrams for Section Analysis
The different types of stress-strain diagrams available for concrete, according to NBR6118 are the following:
|
TSDSSD= 0: |
User defined |
|
TSDSSD= 1: |
Parabolic-rectangular |
3.4.23.6.1 Definition of the parabolic-rectangular stress-strain diagram (TSDSSD = 1):
Number of diagram points
NPSDSSD = 12
The sign criterion for the definition of points of the stress-strain diagram is as follows:
+Tension, -Compression
Strain values for this diagram are the following:
|
SDEPS (1) |
= |
-0.0035 |
|
SDEPS (2) |
= |
-0.0020 |
|
SDEPS (3) |
= |
0.9*(-0.0020) |
|
SDEPS (4) |
= |
0.8*(-0.0020) |
|
SDEPS (5) |
= |
0.7*(-0.0020) |
|
SDEPS (6) |
= |
0.6*(-0.0020) |
|
SDEPS (7) |
= |
0.5*(-0.0020) |
|
SDEPS (8) |
= |
0.4*(-0.0020) |
|
SDEPS (9) |
= |
0.3*(-0.0020) |
|
SDEPS (10) |
= |
0.2*(-0.0020) |
|
SDEPS (11) |
= |
0.1*(-0.0020) |
|
SDEPS (12) |
= |
0.000 |
The corresponding stress values are the following:
For the first 11 points:
SDSGM(i) = 1000*SDEPS(i) *(250*SDEPS(i) +1)*0.85*fcd_t
For point 12:
SDSGM(i) = -0.85*fcd_t
3.4.24 NBR6118 (Reinforcement Steel)
For this type of material (Type = 3) the following properties are defined:
3.4.24.1 Partial Safety Factors
|
GAMs |
Steel partial safety factor (GAMs ³ 0) gs = 1.15 (default value) |
3.4.24.2 Mechanical Properties
|
fyk |
Characteristic yield stress (Art. 8.3.6) Refers to the characteristic value of the applied load over the area of the transverse section. |
|
fyd |
Design yield stress (Art. 8.3.6) fyd = fyk/GAMs |
|
ftk |
Characteristic tensile stress (Art. 8.3.6). Refers to the characteristic value of the maximum axial load in tension over the area of the transverse section. |
|
EPSuk |
Characteristic elongation at maximum load (Art. 8.3.6) EPSuk ³ 0 |
3.4.24.3 Stress-Strain Diagrams for Structural Analysis
The different types of stress-strain diagrams available for reinforcement steel, according to NBR6118 are the following:
|
TSASSD= 0 |
User defined |
|
TSASSD= 1 |
Elastic |
|
TSASSD= 2 |
Bilinear |
3.4.24.3.1 Definition of the Elastic diagram (TSASSD = 1):
Number of diagram points
NPSASSD = 2
The sign criterion for the definition of points of the stress-strain diagram is as follows:
+Tension, -Compression
Strain points have been taken as follows:
|
SAEPS (1) |
= |
-10-2 |
|
SAEPS (2) |
= |
10-2 |
Stress points have been taken as follows:
|
SASGM (1) |
= |
SAEPS(1)*Ex |
|
SASGM (2) |
= |
SAEPS(2)*Ex |
3.4.24.3.2 Definition of the Bilinear diagram (TSASSD = 2):
Number of diagram points
NPSASSD = 4
The sign criterion for the definition of points of the stress-strain diagram is as follows:
+Tension, -Compression
Strain points have been taken as the follows:
|
SAEPS (1) |
= |
-0.01 |
|
SAEPS (2) |
= |
-fyk/Ex |
|
SAEPS (3) |
= |
fyk/Ex |
|
SAEPS (4) |
= |
0.01 |
Stress points have been taken as follows:
|
SASGM (1) |
= |
-fyk+(SAEPS(1)-SAEPS(2))/PLRAT*Ex |
|
SASGM (2) |
= |
-fyk |
|
SASGM (3) |
= |
fyk |
|
SASGM (4) |
= |
fyk+(SAEPS(4)-SAEPS(3))/PLRAT*Ex |
3.4.24.4 Stress-Strain Diagrams for Section Analysis
The different types of stress-strain diagrams available for reinforcement steel, according to NBR6118 are the following:
|
TSDSSD= 0 |
User defined |
|
TSDSSD= 1 |
Design diagram |
3.4.24.4.1 Definition of the Design Diagram (TSDSSD = 1):
Number of diagram points
NPSDSSD = 4
The sign criterion for the definition of points of the stress-strain diagram is as follows:
+Tension, -Compression
Strain points have been taken as follows:
|
SDEPS (1) |
= |
-0.01 |
|
SDEPS (2) |
= |
-fyd/Ex |
|
SDEPS (3) |
= |
fyd/Ex |
|
SDEPS (4) |
= |
0.01 |
The corresponding stress points are the following:
|
SDSGM (1) |
= |
-fyd |
|
SDSGM (2) |
= |
-fyd |
|
SDSGM (3) |
= |
fyd |
|
SDSGM (4) |
= |
fyd |
3.4.25 Indian Standard 456 (Concrete)
For this type of material (Type = 2) the following properties are considered:
3.4.25.1 Type of Cement
|
CeTp |
Refers to the different types of cement used. These types can be chosen among those considered in the CEB-FIP code:
|
3.4.25.2 Partial Safety Factors
|
GAMc |
Partial safety factor for concrete (Art. 36.4.2.1 GAMc ³ 1) gc=1 (Default value) |
3.4.25.3 Mechanical Properties
|
fck |
Concrete characteristic 28-day compressive strength (Art. 6.1) (+Compression fck ³ 0) |
||||||||
|
fcd |
Design 28-day compressive strength (Art. 36.3.1) (+Compression) fcd = fck/GAMc |
||||||||
|
fct |
Characteristic
tensile strength (Art. 6.2.2) (+Tension) |
||||||||
|
Ec |
28 days elasticity modulus (Art. 6.2.3.1) Ec = 5000*(fck)1/2 (Ec and fck in N/mm2) |
||||||||
|
s |
Coefficient which depends on the type of cement. (chosen among those considered in the CEB-FIP code)
|
3.4.25.4 Time Dependent Mechanical Properties
|
BETcc |
Coefficient which depends on concrete age. BETcc = exp {s*[1-(28/Age)1/2]} (Age is expressed in days) |
|
fcm_t(Age) |
Mean compressive strength. (+ Compression) fcm_t = BETcc*fcm |
|
fck_t(Age) |
Characteristic t-day compressive strength. (+ Compression) fck_t = fcm_t - 8 (fck_t and fcm in N/mm2) |
|
fcd_t(Age) |
Design t-day compressive strength (Art. 4.2.1.3.3 (4) & (11)) (+Compression) fcd_t = fck_t/GAMc |
|
Ec_t(t) |
Modulus of elasticity Ec_t = 5000*(fctk_t)1/2 (Ec_t and fck_t in N/mm2) |
3.4.25.5 Stress-Strain Diagrams for Structural Analysis
The different types of stress-strain concrete diagrams available according to IS456 are:
|
TSASSD= 0 |
User defined |
|
TSASSD= 1 |
Elastic |
3.4.25.5.1 Definition of the elastic stress-strain diagram (TSASSD = 1):
The sign criterion for the definition of stress-strain diagram points is as follows:
+Tension, -Compression
A total of 2 points (NPSASSD = 2) has been chosen for the definition of the stress-strain diagram. Strain values are the following:
|
SAEPS (1) |
= |
-10-2 |
|
SAEPS (2) |
= |
10-2 |
For these points, stress values are the following:
|
SASGM (i) = SAEPS (i) * Ex |
3.4.25.6 Stress-Strain Diagrams for Section Analysis
The different types of stress-strain diagrams available for concrete, according to Eurocode 2 are the following:
|
TSDSSD= 0 |
User defined |
|
TSDSSD= 1 |
Parabolic-rectangular |
3.4.25.6.1 Definition of the parabolic-rectangular stress-strain diagram (TSDSSD = 1):
Number of diagram points
NPSDSSD = 12
The sign criterion for the definition of points of the stress-strain diagram is as follows:
+Tension, -Compression
Strain values for this diagram are the following:
|
SDEPS (1) |
= |
-0.0035 |
|
SDEPS (2) |
= |
-0.0020 |
|
SDEPS (3) |
= |
0.9*(-0.0020) |
|
SDEPS (4) |
= |
0.8*(-0.0020) |
|
SDEPS (5) |
= |
0.7*(-0.0020) |
|
SDEPS (6) |
= |
0.6*(-0.0020) |
|
SDEPS (7) |
= |
0.5*(-0.0020) |
|
SDEPS (8) |
= |
0.4*(-0.0020) |
|
SDEPS (9) |
= |
0.3*(-0.0020) |
|
SDEPS (10) |
= |
0.2*(-0.0020) |
|
SDEPS (11) |
= |
0.1*(-0.0020) |
|
SDEPS (12) |
= |
0.000 |
The corresponding stress values are the following:
For the first 11 points:
SDSGM(i) = 1000*SDEPS(i) *(250*SDEPS(i) +1)*0.67*fcd_t
For point 12:
SDSGM(i) = -0.67*fcd_t
3.4.26 Indian Standard 456 (Reinforcement Steel)
For this type of material (Type = 3) the following properties are defined:
3.4.26.1 Partial Safety Factors
|
GAMs |
Steel partial safety factor (Art. 36.3.1) (GAMs ³ 0) gs = 1.0 (default value) |
3.4.26.2 Mechanical Properties
|
fy |
Characteristic yield stress. Refers to the characteristic value of the applied load over the area of the transverse section. |
|
fyd |
Design yield stress fyd = fyk/GAMs |
|
ft |
Characteristic tensile stress. Refers to the characteristic value of the maximum axial load in tension over the area of the transverse section. |
|
EPSuk |
Characteristic elongation at maximum load EPSuk ³ 0 |
3.4.26.3 Stress-Strain Diagrams for Structural Analysis
The different types of stress-strain diagrams available for reinforcement steel, according to IS456 are the following:
|
TSASSD= 0: |
User defined |
|
TSASSD= 1: |
Elastic |
|
TSASSD= 2: |
Bilinear |
3.4.26.3.1 Definition of the Elastic diagram (TSASSD = 1):
Number of diagram points
NPSASSD = 2
The sign criterion for the definition of points of the stress-strain diagram is as follows:
+Tension, -Compression
Strain points are the following:
|
SAEPS (1) |
= |
-10-2 |
|
SAEPS (2) |
= |
10-2 |
Stress points are the following:
|
SASGM (1) |
= |
SAEPS(1)*Ex |
|
SASGM (2) |
= |
SAEPS(1)*Ex |
3.4.26.3.2 Definition of the Bilinear diagram (TSASSD = 2):
Number of diagram points
NPSASSD = 4
The sign criterion for the definition of points of the stress-strain diagram is as follows:
+Tension, -Compression
Strain points are the following:
|
SAEPS (1) |
= |
-0.01 |
|
SAEPS (2) |
= |
-fy/Ex |
|
SAEPS (3) |
= |
fy/Ex |
|
SAEPS (4) |
= |
0.01 |
Stress points are the following:
|
SASGM (1) |
= |
-fy+(SAEPS(1)-SAEPS(2))/PLRAT*Ex |
|
SASGM (2) |
= |
-fy |
|
SASGM (3) |
= |
fy |
|
SASGM (4) |
= |
-fy+(SAEPS(4)-SAEPS(3))/PLRAT*Ex |
3.4.26.4 Stress-strain Diagrams for Section Analysis
The different types of stress-strain diagrams available for reinforcement steel, according to IS456 are the following:
|
TSDSSD= 0 |
User defined |
|
TSDSSD= 1 |
Bilinear |
3.4.26.4.1 Definition of the bilinear diagram (TSDSSD = 1):
Number of diagram points
NPSDSSD = 4
The sign criterion for the definition of points of the stress-strain diagram is as follows:
+Tension, -Compression
Strain points have been taken according to article Art. 4.2.2.3.2 and are the following:
|
SDEPS (1) |
= |
-0.01 |
|
SDEPS (2) |
= |
-fyd/Ex |
|
SDEPS (3) |
= |
fyd/Ex |
|
SDEPS (4) |
= |
0.01 |
The corresponding stress points are the following:
|
SDSGM (1) |
= |
-fyd |
|
SDSGM (2) |
= |
-fyd |
|
SDSGM (3) |
= |
fyd |
|
SDSGM (4) |
= |
fyd |
3.4.27 Russian Code SP-52-101 (CP 52-101) (Concrete)
For this type of material (Type = 2) the following properties are considered:
3.4.27.1 Type of Cement
|
CeTp |
Refers to the different types of cement that can be used. Chosen among those considered in the CEB-FIP code:
|
3.4.27.2 Partial Safety Factors
|
GAMb |
Partial safety factor for compressed concrete (Art. 2.1.2.2. GAMb ³ 1) gb=1.5 (Default value) |
|
GAMbt |
Partial safety factor for tensioned concrete (Art. 2.1.2.2. GAMbt ³ 1) gbt=1.3 (Default value) |
3.4.27.3 Mechanical Properties
|
Rbn |
Concrete characteristic 28-day compressive strength (Art. 2.1.2.1) (+Compression Rbn ³ 0) |
||||||||
|
Rb |
Design 28-day compressive strength (Art. 2.1.2.2) (+Compression) Rb = Rbn/GAMb |
||||||||
|
Rbtn |
Concrete characteristic 28 days tensile strength (Art. 2.1.2.1) (+Tension) |
||||||||
|
Rbt |
Design 28 days tensile strength (Art. 2.1.2.2) (+Tension) Rbt = Rbtn/GAMb |
||||||||
|
EPSb0 |
Strain value at the end of the second segment of the strain-stress curve (Art. 21.2.5) (- Compression) EPSc1 = -0.0022 (Default value) |
||||||||
|
EPSb2 |
Ultimate
strain in compression (Art. 2.1.2.11) |
||||||||
|
s |
Coefficient which depends on the type of cement. Chosen among those considered in the CEB-FIP code.
|
3.4.27.4 Time Dependent Mechanical Properties
|
BETcc |
Coefficient which depends on concrete age. BETcc = exp {s*[1-(28/Age)1/2]} (Age is expressed in days) |
|
Rbn_t(Age) |
Characteristic t-day compressive strength. (+ Compression) Rbn_t = BETcc*Rbn |
|
Rb_t(Age) |
Design t-day compressive strength (Art. 4.2.1.3.3 (4) & (11)) (+Compression) Rb_t = Rbn_t/GAMb |
|
Eb(Age) |
Initial modulus of elasticity (Table 2.1-4) |
3.4.27.5 Stress-Strain Diagrams for Structural Analysis
The different types of stress-strain concrete diagrams available according to SP 52-101 are:
|
TSASSD= 0: |
User defined |
|
TSASSD= 1: |
Elastic |
|
TSASSD= 2: |
Bilinear |
|
TSASSD= 3: |
Trilinear |
3.4.27.5.1 Definition of the elastic stress-strain diagram (TSASSD = 1):
The sign criterion for the definition of stress-strain diagram points is as follows:
+Tension, -Compression
A total of 2 points (NPSASSD = 2) has been chosen for the definition of the stress-strain diagram. Strain values are the following:
|
SAEPS (1) |
= |
-10-2 |
|
SAEPS (2) |
= |
10-2 |
For these points, stress values are the following:
|
SASGM (i) = SAEPS (i) * Ex |
3.4.27.5.2 Definition of the bilinear stress-strain diagram (TSASSD = 2):
The sign criterion for the definition of stress-strain diagram points is as follows:
+Tension, -Compression
A total of 3 points (NPSASSD = 4) has been chosen for the definition of the stress-strain diagram. Strain values conform to article Art. 2.1.2.12 and are the following:
|
SAEPS (1) |
= |
EPSb2 |
|
SAEPS (2) |
= |
0.0015/GAMb |
|
SAEPS (3) |
= |
0.000 |
For these points, stress values are the following:
|
SASGM (1) |
= |
-Rb_t |
|
SASGM (2) |
= |
-Rb_t |
|
SASGM (3) |
= |
0.000 |
3.4.27.5.3 Definition of the trilinear stress-strain diagram (TSASSD = 3):
The sign criterion for the definition of stress-strain diagram points is as follows:
+Tension, -Compression
A total of 4 points (NPSASSD = 4) has been chosen for the definition of the stress-strain diagram. Strain values conform to article Art. 2.1.2.11 and are the following:
|
SAEPS (1) |
= |
EPSb2 |
|
SAEPS (2) |
= |
EPSb0 |
|
SAEPS (3) |
= |
0.6*Rd/Eb |
|
SAEPS (4) |
= |
0.000 |
For these points, stress values are the following:
|
SASGM (1) |
= |
-Rb_t |
|
SASGM (2) |
= |
-Rb_t |
|
SASGM (3) |
= |
-0.6*Rb_t |
|
SASGM (4) |
= |
0.000 |
3.4.27.6 Stress-Strain Diagrams for Section Analysis
The different types of stress-strain diagrams available for concrete, according to SP 52-101 are the following:
|
TSDSSD= 0 |
User defined |
|
TSDSSD= 1 |
Bilinear |
|
TSDSSD= 2 |
Trilinear |
3.4.27.6.1 Definition of the bilinear stress-strain diagram (TSDSSD = 1):
Number of diagram points
NPSDSSD = 3
The sign criterion for the definition of points of the stress-strain diagram is as follows (according to Art. 2.1.2.12):
+Tension, -Compression
Strain values for this diagram are the following:
|
SDEPS (1) |
= |
EPSb2 |
|
SDEPS (2) |
= |
0.0015/GAMb |
|
SDEPS (3) |
= |
0.000 |
The corresponding stress values are the following:
|
SDSGM (1) |
= |
-Rb_t |
|
SDSGM (2) |
= |
-Rb_t |
|
SDSGM (3) |
= |
0.000 |
3.4.27.6.2 Definition of the trilinear diagram (TSDSSD = 2):
Number of diagram points
NPSDSSD = 4
The sign criterion for the definition of points of the stress-strain diagram is as follows:
+Tension, -Compression
A total of 4 points (NPSDSSD = 4) has been chosen for the definition of the stress-strain diagram. Strain values conform to article Art. 2.1.2.11 and are the following:
|
SDEPS (1) |
= |
EPSb2 |
|
SDEPS (2) |
= |
EPSb0 |
|
SDEPS (3) |
= |
0.6*Rd/Eb |
|
SDEPS (4) |
= |
0.000 |
Stress points are the following:
|
SDSGM (1) |
= |
-Rb_t |
|
SDSGM (2) |
= |
-Rb_t |
|
SDSGM (3) |
= |
-0.6*Rb_t |
|
SDSGM (4) |
= |
0.000 |
3.4.28 Russian Code SP-52-101 (CP 52-101) (Reinforcement Steel)
For this type of material (Type = 3) the following properties are defined:
3.4.28.1 Partial Safety Factors
|
GAMs |
Steel partial safety factor (Art. 2.3.3.2) (GAMs ³ 0) gs = 1.00 (default value) (Art. 2.2.2.2) |
3.4.28.2 Mechanical Properties
|
Rsn |
Characteristic yield stress (Art. 2.2.2.2) Refers to the characteristic value of the applied load over the area of the transverse section. |
|
Rs |
Design yield stress (Art. 2.2.2.2) Rs = Rsn/GAMs |
|
Rsw |
Characteristic tensile stress in the stirrups (Art. 2.2.2.3) Rs = 0.8*Rs £ 500 MPa |
|
EPSs2 |
Characteristic elongation at maximum load (Art. 2.2.2.7) EPSs2 ³ 0 |
3.4.28.3 Stress-strain Diagrams for Structural Analysis
The different types of stress-strain diagrams available for reinforcement steel, according to SP 52-101 are the following:
|
TSASSD= 0 |
User defined |
|
TSASSD= 1 |
Elastic |
|
TSASSD= 2 |
Bilinear |
3.4.28.3.1 Definition of the Elastic diagram (TSASSD = 1):
Number of diagram points
NPSASSD = 2
The sign criterion for the definition of points of the stress-strain diagram is as follows:
+Tension, -Compression
Strain points are the following:
|
SAEPS (1) |
= |
-1.0E-2 |
|
SAEPS (2) |
= |
1.0E-2 |
Stress points are the following:
|
SASGM (1) |
= |
SAEPS(1)*Ex |
|
SASGM (2) |
= |
SAEPS(2)*Ex |
3.4.28.3.2 Definition of the Bilinear diagram (TSASSD = 2):
Number of diagram points
NPSASSD = 3
The sign criterion for the definition of points of the stress-strain diagram is as follows:
+Tension, -Compression
Strain points conform to article Art. 2.2.2.7 and are the following:
|
SAEPS (1) |
= |
-EPSs2 |
|
SAEPS (2) |
= |
-Rs/Ex |
|
SAEPS (3) |
= |
Rs/Ex |
|
SAEPS (4) |
= |
EPSs2 |
Stress points conform to article Art. 2.2.2.7 and are the following:
|
SASGM (1) |
= |
-Rs |
|
SASGM (2) |
= |
-Rs |
|
SASGM (3) |
= |
Rs |
|
SASGM (4) |
= |
Rs |
3.4.28.4 Stress-Strain Diagrams for Section Analysis
The different types of stress-strain diagrams available for reinforcement steel, according to SP 52-101 are the following:
|
TSDSSD= 0 |
User defined |
|
TSDSSD= 1 |
Bilinear |
3.4.28.4.1 Definition of the bilinear stress-strain diagram (TSDSSD = 1):
Number of diagram points
NPSDSSD = 4
The sign criterion for the definition of points of the stress-strain diagram is as follows:
+Tension, -Compression
Strain points are in accordance with article Art. 2.2.2.7 and are the following:
|
SDEPS (1) |
= |
-EPSs2 |
|
SDEPS (2) |
= |
-Rs/Ex |
|
SDEPS (3) |
= |
Rs/Ex |
|
SDEPS (4) |
= |
EPSs2 |
The corresponding stress points are the following:
|
SDSGM (1) |
= |
-Rs |
|
SDSGM (2) |
= |
-Rs |
|
SDSGM (3) |
= |
Rs |
|
SDSGM (4) |
= |
Rs |
3.4.29 Russian Code SP 63.13330.2012 (CP 63.13330.2012) (Concrete)
For this type of material (Type = 2) the following properties are considered:
3.4.29.1 Type of Cement
|
CeTp |
Refers to the different types of cement that can be used. Chosen among those considered in the CEB-FIP code:
|
3.4.29.2 Partial Safety Factors
|
GAMb |
Partial safety factor for compressed concrete (Art. 6.1.11 GAMb ³ 1) gb=1.5 (Default value) |
|
GAMbt |
Partial safety factor for tensioned concrete (Art. 6.1.11. GAMbt ³ 1) gbt=1.3 (Default value) |
3.4.29.3 Mechanical Properties
|
Rbn |
Concrete characteristic 28-day compressive strength (Table 6.8) (+Compression Rbn ³ 0) |
||||||||
|
Rb |
Design 28-day compressive strength (Art. 6.1.11) (+Compression) Rb = Rbn/GAMb |
||||||||
|
Rbtn |
Concrete characteristic 28 days tensile strength (Table 6.8) (+Tension) |
||||||||
|
Rbt |
Design 28 days tensile strength (Art. 6.1.11) (+Tension) Rbt = Rbtn/GAMb |
||||||||
|
EPSb0 |
Strain value at the end of the second segment of the strain-stress curve (Art. 6.1.14) (- Compression |
||||||||
|
EPSb2 |
Ultimate
strain in compression (Art. 6.1.20) |
||||||||
|
s |
Coefficient which depends on the type of cement. Chosen among those considered in the CEB-FIP code.
|
3.4.29.4 Time Dependent Mechanical Properties
|
BETcc |
Coefficient which depends on concrete age. BETcc = exp {s*[1-(28/Age)1/2]} (Age is expressed in days) |
|
Rbn_t(Age) |
Characteristic t-day compressive strength. (+ Compression) Rbn_t = BETcc*Rbn |
|
Rb_t(Age) |
Design t-day compressive strength (+Compression) Rb_t = Rbn_t/GAMb |
|
Eb(Age) |
Initial modulus of elasticity (Tabla 6.11) |
3.4.29.5 Stress-Strain Diagrams for Structural Analysis
The different types of stress-strain concrete diagrams available according to SP 63.13330.2012 are:
|
TSASSD= 0: |
User defined |
|
TSASSD= 1: |
Elastic |
|
TSASSD= 2: |
Bilinear |
|
TSASSD= 3: |
Trilinear |
3.4.29.5.1 Definition of the elastic stress-strain diagram (TSASSD = 1):
The sign criterion for the definition of stress-strain diagram points is as follows:
+Tension, -Compression
A total of 2 points (NPSASSD = 2) has been chosen for the definition of the stress-strain diagram. Strain values are the following:
|
SAEPS (1) |
= |
-10-2 |
|
SAEPS (2) |
= |
10-2 |
For these points, stress values are the following:
|
SASGM (i) = SAEPS (i) * Ex |
3.4.29.5.2 Definition of the bilinear stress-strain diagram (TSASSD = 2):
The sign criterion for the definition of stress-strain diagram points is as follows:
+Tension, -Compression
A total of 3 points (NPSASSD = 4) has been chosen for the definition of the stress-strain diagram. Strain values conform to article Art. 2.1.2.12 and are the following:
|
SAEPS (1) |
= |
EPSb2 |
|
SAEPS (2) |
= |
0.0015 |
|
SAEPS (3) |
= |
0.000 |
For these points, stress values are the following:
|
SASGM (1) |
= |
-Rb_t |
|
SASGM (2) |
= |
-Rb_t |
|
SASGM (3) |
= |
0.000 |
3.4.29.5.3 Definition of the trilinear stress-strain diagram (TSASSD = 3):
The sign criterion for the definition of stress-strain diagram points is as follows:
+Tension, -Compression
A total of 4 points (NPSASSD = 4) has been chosen for the definition of the stress-strain diagram. Strain values conform to article Art. 2.1.2.11 and are the following:
|
SAEPS (1) |
= |
EPSb2 |
|
SAEPS (2) |
= |
EPSb0 |
|
SAEPS (3) |
= |
0.6*Rd/Eb |
|
SAEPS (4) |
= |
0.000 |
For these points, stress values are the following:
|
SASGM (1) |
= |
-Rb_t |
|
SASGM (2) |
= |
-Rb_t |
|
SASGM (3) |
= |
-0.6*Rb_t |
|
SASGM (4) |
= |
0.000 |
3.4.29.6 Stress-Strain Diagrams for Section Analysis
The different types of stress-strain diagrams available for concrete, according to SP 52-101 are the following:
|
TSDSSD= 0 |
User defined |
|
TSDSSD= 1 |
Bilinear |
|
TSDSSD= 2 |
Trilinear |
3.4.29.6.1 Definition of the bilinear stress-strain diagram (TSDSSD = 1):
Number of diagram points
NPSDSSD = 3
The sign criterion for the definition of points of the stress-strain diagram is as follows (according to Art. 2.1.2.12):
+Tension, -Compression
Strain values for this diagram are the following:
|
SDEPS (1) |
= |
EPSb2 |
|
SDEPS (2) |
= |
0.0015 |
|
SDEPS (3) |
= |
0.000 |
The corresponding stress values are the following:
|
SDSGM (1) |
= |
-Rb_t |
|
SDSGM (2) |
= |
-Rb_t |
|
SDSGM (3) |
= |
0.000 |
3.4.29.6.2 Definition of the trilinear diagram (TSDSSD = 2):
Number of diagram points
NPSDSSD = 4
The sign criterion for the definition of points of the stress-strain diagram is as follows:
+Tension, -Compression
A total of 4 points (NPSDSSD = 4) has been chosen for the definition of the stress-strain diagram. Strain values conform to article Art. 2.1.2.11 and are the following:
|
SDEPS (1) |
= |
EPSb2 |
|
SDEPS (2) |
= |
EPSb0 |
|
SDEPS (3) |
= |
0.6*Rd/Eb |
|
SDEPS (4) |
= |
0.000 |
Stress points are the following:
|
SDSGM (1) |
= |
-Rb_t |
|
SDSGM (2) |
= |
-Rb_t |
|
SDSGM (3) |
= |
-0.6*Rb_t |
|
SDSGM (4) |
= |
0.000 |
3.4.30 Russian Code 63.13330.2012 (CP 63.13330.2012) (Reinforcement Steel)
For this type of material (Type = 3) the following properties are defined:
3.4.30.1 Partial Safety Factors
|
GAMs |
Steel partial safety factor (GAMs ³ 0) gs = 1.15 (default value) (Art. 6.2.8) |
3.4.30.2 Mechanical Properties
|
Rsn |
Characteristic yield stress (Table 6.13) Refers to the characteristic value of the applied load over the area of the transverse section. |
|
Rs |
Design yield stress (Art. 6.2.8) Rs = Rsn/GAMs |
|
Rsw |
Characteristic tensile stress in the stirrups Rs = 0.8*Rs £ 300 MPa |
|
EPSs2 |
Characteristic elongation at maximum load (Art. 6.2.14) EPSs2 ³ 0 |
3.4.30.3 Stress-strain Diagrams for Structural Analysis
The different types of stress-strain diagrams available for reinforcement steel, according to SP 63.13330.2012 are the following:
|
TSASSD= 0 |
User defined |
|
TSASSD= 1 |
Elastic |
|
TSASSD= 2 |
Bilinear |
|
TSASSD= 3 |
Trilineal |
3.4.30.3.1 Definition of the Elastic diagram (TSASSD = 1):
Number of diagram points
NPSASSD = 2
The sign criterion for the definition of points of the stress-strain diagram is as follows:
+Tension, -Compression
Strain points are the following:
|
SAEPS (1) |
= |
-1.0E-2 |
|
SAEPS (2) |
= |
1.0E-2 |
Stress points are the following:
|
SASGM (1) |
= |
SAEPS(1)*Ex |
|
SASGM (2) |
= |
SAEPS(2)*Ex |
3.4.30.3.2 Definition of the Bilinear diagram (TSASSD = 2):
Number of diagram points
NPSASSD = 4
The sign criterion for the definition of points of the stress-strain diagram is as follows:
+Tension, -Compression
Strain points conform to article Art. 6.2.14 and are the following:
|
SAEPS (1) |
= |
-EPSs2 |
|
SAEPS (2) |
= |
-Rs/Ex |
|
SAEPS (3) |
= |
Rs/Ex |
|
SAEPS (4) |
= |
EPSs2 |
Stress points conform to article Art. 6.2.14 and are the following:
|
SASGM (1) |
= |
-Rs |
|
SASGM (2) |
= |
-Rs |
|
SASGM (3) |
= |
Rs |
|
SASGM (4) |
= |
Rs |
3.4.30.3.3 Definition of the Trilinear diagram (TSASSD = 3):
Number of diagram points
NPSASSD = 6
The sign criterion for the definition of points of the stress-strain diagram is as follows:
+Tension, -Compression
Strain points conform to article Art. 6.2.15 and are the following:
|
SAEPS (1) |
= |
-0.015 |
|
||
|
SAEPS (2) |
= |
-(2*((Rs/Ex) + 0.002) - (Rs/Ex)*0.9) |
|||
|
SAEPS (3) |
= |
-(Rs/Ex)*0.9 |
|
||
|
SAEPS (4) |
= |
(Rs/Ex)*0.9 |
|
||
|
SAEPS (5) |
= |
2*((Rs/Ex) + 0.002) - (Rs/Ex)*0.9 |
|
||
|
SAEPS (6) |
= |
0.015 |
|
||
Stress points conform to article Art. 6.2.15 and are the following:
|
SASGM (1) |
= |
-1.1*Rs |
|
SASGM (2) |
= |
-1.1*Rs |
|
SASGM (3) |
= |
-0.9*Rs |
|
SASGM (4) |
= |
0.9*Rs |
|
SASGM (5) |
= |
1.1*Rs |
|
SASGM (6) |
= |
1.1*Rs |
3.4.30.4 Stress-Strain Diagrams for Section Analysis
The different types of stress-strain diagrams available for reinforcement steel, according to SP 52-101 are the following:
|
TSDSSD= 0 |
User defined |
|
|
TSDSSD= 1 |
Bilinear |
|
|
TSDSSD= 2 |
Trilineal |
|
3.4.30.4.1 Definition of the bilinear stress-strain diagram (TSDSSD = 1):
Number of diagram points
NPSDSSD = 4
The sign criterion for the definition of points of the stress-strain diagram is as follows:
+Tension, -Compression
Strain points are in accordance with article Art. 2.2.2.7 and are the following:
|
SDEPS (1) |
= |
-EPSs2 |
|
SDEPS (2) |
= |
-Rs/Ex |
|
SDEPS (3) |
= |
Rs/Ex |
|
SDEPS (4) |
= |
EPSs2 |
The corresponding stress points are the following:
|
SDSGM (1) |
= |
-Rs |
|
SDSGM (2) |
= |
-Rs |
|
SDSGM (3) |
= |
Rs |
|
SDSGM (4) |
= |
Rs |
|
|
|
|
3.4.30.4.2 Definition of the trilinear stress-strain diagram (TSDSSD = 2):
Number of diagram points
NPSDSSD = 6
The sign criterion for the definition of points of the stress-strain diagram is as follows:
+Tension, -Compression
Strain points conform to article Art. 6.2.15 and are the following:
|
SAEPS (1) |
= |
-0.015 |
|
||
|
SAEPS (2) |
= |
-(2*((Rs/Ex) + 0.002) - (Rs/Ex)*0.9) |
|||
|
SAEPS (3) |
= |
-(Rs/Ex)*0.9 |
|
||
|
SAEPS (4) |
= |
(Rs/Ex)*0.9 |
|
||
|
SAEPS (5) |
= |
2*((Rs/Ex) + 0.002) - (Rs/Ex)*0.9 |
|
||
|
SAEPS (6) |
= |
0.015 |
|
||
Stress points conform to article Art. 6.2.15 and are the following:
|
SASGM (1) |
= |
-1.1*Rs |
|
SASGM (2) |
= |
-1.1*Rs |
|
SASGM (3) |
= |
-0.9*Rs |
|
SASGM (4) |
= |
0.9*Rs |
|
SASGM (5) |
= |
1.1*Rs |
|
SASGM (6) |
= |
1.1*Rs |
3.4.31 ITER Structural Design Code for Buildings
This design code specifies the use of the materials defined in Eurocode 2. Therefore, everytime the ITER design code is selected, the material properties will be those defined in Eurocode 2, 2008 revision.
3.5 FLAC3D Properties
The ~CFMP command defines the material properties that are necessary to carry out an analysis with FLAC3D, both for structural and soil and rock elements. These properties possess the labels and values described hereafter:
3.5.1 FLAC3D Material Properties for Soil and Rock Elements
3.5.1.1 Type of Constitutive Model
|
CMOD |
Type of constitutive model
|
3.5.1.2 Elastic Isotropic Model Parameters
|
bu |
Elastic bulk modulus, K K=E/3/(1-2*Un) |
|
sh |
Elastic shear modulus, G G=E/2/(1+Nu) |
3.5.1.3 Elastic Orthotropic Model Parameters
|
dd |
Dip direction of plane defined by axes 1'-2' |
|
dip |
Dip angle of plane defined by axes 1'-2' |
|
e1 |
Young's modulus in direction 1' |
|
e2 |
Young's modulus in direction 2' |
|
e3 |
Young's modulus in direction 3' |
|
g12 |
Shear modulus in planes parallel to axes 1'-2' |
|
g13 |
Shear modulus in planes parallel to axes 1'-3' |
|
g23 |
Shear modulus in planes parallel to axes 2'-3' |
|
nu12 |
Poisson’s ratio characterizing lateral contraction in direction 1' when tension is applied in direction 2' |
|
nu13 |
Poisson’s ratio characterizing lateral contraction in direction 1' when tension is applied in direction 3' |
|
nu23 |
Poisson’s ratio characterizing lateral contraction in direction 2' when tension is applied in direction 3' |
|
nx |
x-component of unit normal to plane defined by axes 1'-2' |
|
ny |
y-component of unit normal to plane defined by axes 1'-2' |
|
nz |
z-component of unit normal to plane defined by axes 1'-2' |
|
rot |
Rotation angle between the 1' axis and the dip-direction vector, positive clockwise defined, starting at the dip-direction vector |
3.5.1.4 Elastic Transversely Isotropic Model Parameters
|
dd |
Dip direction of the plane of isotropy |
|
Dip |
Dip angle of the plane of isotropy |
|
E1 |
Young's modulus in the plane of isotropy |
|
E3 |
Young's modulus normal to the plane of isotropy |
|
G13 |
Shear modulus for any plane normal to the plane of isotropy |
|
Nu12 |
Poisson’s ratio characterizing lateral contraction in the plane of isotropy when tension is applied in the plane |
|
Nu13 |
Poisson’s ratio characterizing lateral contraction in the plane of isotropy when tension is applied normal to the plane |
3.5.1.5 Drucker-Prager Model Parameters
|
Bu |
Elastic bulk modulus, K |
|
Ks |
Material parameter, phi |
|
Qd |
Material parameter, qpsi |
|
Qv |
Material parameter, phi |
|
Sh |
Elastic shear modulus, G |
|
ten |
Tension limit, SIGt |
3.5.1.6 Mohr-Coulomb Model Parameters
|
bu |
Elastic bulk modulus, K |
|
C |
Cohesion, c |
|
Di |
Dilatancy angle, psi |
|
Fric |
Internal angle of friction, phi |
|
Sh |
Elastic shear modulus, G |
|
ten |
Tension limit, SIGt |
3.5.1.7 Ubiquitous-Joint Model Parameters
|
bu |
Elastic bulk modulus, K |
|
C |
Cohesion of matrix, c |
|
Di |
Dilation angle of matrix, psi |
|
Fric |
Internal angle of friction, phi |
|
Jc |
Joint cohesion, cj |
|
Jdd |
Dip direction of weakness plane |
|
Jdil |
Joint dilation angle, psij |
|
Jdip |
Dip angle of weakness plane |
|
Jf |
Joint friction angle, phij |
|
Jnx |
x-component of unit normal to weakness plane |
|
Jny |
y-component of unit normal to weakness plane |
|
Jnz |
z-component of unit normal to weakness plane |
|
Jt |
Joint tension limit, SIGtj |
|
Sh |
Elastic shear modulus, G |
|
ten |
Tension limit of matrix, SIGt |
3.5.1.8 Strain-hardening/softening Model Parameters
|
bu |
Elastic bulk modulus, K |
|
C |
Cohesion, c |
|
Ct |
Number of the table relating cohesion to plastic shear strain |
|
Di |
Dilation angle, psi |
|
Dt |
Number of table relating dilation angle to plastic shear strain |
|
Fric |
Angle of internal friction, phi |
|
Ft |
Number of the table relating friction angle to plastic shear strain |
|
Sh |
Elastic shear modulus, G |
|
Ten |
Tension limit, SIGt |
|
tt |
Number of table relating tension limit to plastic tensile strain |
3.5.1.9 Bilinear Strain-hard/soft Ubiquitous-Joint Model Parameters
|
Bij |
=0 for joint linear model (default) =1 for joint bilinear model |
|
Bim |
=0 for matrix linear model (default) =1 for matrix bilinear model |
|
bu |
Elastic bulk modulus, K |
|
C2 |
Number of table relating matrix cohesion c2 to matrix plastic shear strain |
|
Cj |
Number of table relating joint cohesion cj1 to joint plastic shear strain |
|
Cj2 |
Number of table relating joint cohesion cj2 to joint plastic shear strain |
|
C |
Matrix cohesion, c1 |
|
Co2 |
Matrix cohesion, c2 |
|
Ct |
Number of table relating matrix cohesion c1 to matrix plastic shear strain |
|
D2 |
Number of table relating matrix dilation psi2 to matrix plastic shear strain |
|
Di2 |
Matrix dilation angle, psi2 |
|
Di |
Matrix dilation angle, psi1 |
|
Dj |
Number of table relating joint dilation psij1 to joint plastic shear strain |
|
Dj2 |
Number of table relating joint dilation psij2 to joint plastic shear strain |
|
Dt |
Number of table relating matrix dilation angle psi1 to matrix plastic shear strain |
|
F2 |
Number of table relating matrix friction angle phi2 to matrix plastic shear strain |
|
Fj |
Number of table relating joint friction angle phij1 to joint plastic shear strain |
|
Fj2 |
Number of table relating joint friction angle phij2 to joint plastic shear strain |
|
Fr2 |
Matrix friction angle, phi2 |
|
Fric |
Matrix friction angle, phi1 |
|
Ft |
Number of table relating matrix friction phi1 to matrix plastic shear strain |
|
Jc2 |
Joint cohesion,cj2 |
|
Jc |
Joint cohesion,cj1 |
|
Jdd |
Dip direction of weakness plane |
|
Jdil |
Joint dilation angle, psij1 |
|
Jdip |
Dip angle of weakness plane |
|
Jd2 |
Joint dilation angle, psij2 |
|
Jf |
Joint friction angle, phij1 |
|
Jf2 |
Joint friction angle, phij2 |
|
Jnx |
x-component of unit normal to weakness plane |
|
Jny |
y-component of unit normal to weakness plane |
|
Jnz |
z-component of unit normal to weakness plane |
|
Jt |
Joint tension limit, SIGtj |
|
Sh |
Elastic shear modulus, G |
|
Ten |
Matrix tension limit, SIGt |
|
Tj |
Number of table relating joint tension limit SIGtj to joint plastic tensile strain |
|
Tt |
Number of table relating matrix tension limit SIGtj to joint plastic tensile strain |
3.5.1.10 Double-yield Model Parameters
|
Bu |
Elastic bulk modulus, K |
|
Cap_p |
Current intersection of the volumetric yield surface (cap) with the pressure axis (mean stress), pc |
|
C |
Cohesion, c |
|
Cp |
Number of table relating cap pressure to plastic volume strain |
|
Ct |
Number of table relating cohesion to plastic shear strain |
|
Di |
Dilation angle, psi |
|
Dt |
Number of table relating dilation angle to plastic shear strain |
|
Ev |
Cumulative plastic volumetric strain |
|
F |
Angle of internal friction, phi |
|
Ft |
Number of table relating friction angle to plastic shear strain |
|
Mu |
Multiplier on current plastic cap modulus to provide the elastic bulk and shear moduli, R |
|
S |
Maximum elastic shear modulus, G |
|
T |
Tension limit, SIGt |
|
tt |
Number of table relating tensile limit to plastic tensile strain |
3.5.1.11 Modified Cam-Clay Model Parameters
|
Bulk_b |
Maximum elastic bulk modulus, kmax |
|
Cv |
Initial specific volume, v0 |
|
Ka |
Slope of the elastic swelling line, kappa |
|
L |
Slope of the normal consolidation line, lambda |
|
Mm |
Frictional constant, M |
|
Mpc |
Preconsolidation pressure, pc0 |
|
Mp1 |
Reference pressure, p1 |
|
Mv_l |
Specific volume at reference pressure, p1, on the normal consolidation line, vlambda |
|
P |
Poisson's ratio, nu |
|
sh |
Elastic shear modulus, G |
3.5.2 FLAC3D Material Properties for Structural Elements
3.5.2.1 Type of Constitutive Model
|
TSEL |
Types of structural elements available
|
3.5.2.2 BEAM Element Parameters:
|
density |
Mass density, ro |
|
emod |
Young’s modulus, E |
|
Nu |
Poisson’s ratio, nu |
|
pmoment |
Plastic moment capacity, Mp |
|
thexp |
Thermal expansion coefficient, alphat |
3.5.2.3 CABLE Element Parameters:
|
density |
Mass density, ro |
|
Emod |
Young's modulus, E |
|
Gr_coh |
Grout cohesive strength (force) per unit of length, cg |
|
Gr_fric |
Grout friction angle, phig (º) |
|
Gr_k |
Grout stiffness per unit length, kg |
|
Gr_per |
Grout exposed perimeter, pg |
|
Slide |
Large-strain sliding flag (default: OFF) |
|
Slide_to |
Large-strain sliding tolerance |
|
Thexp |
Thermal expansion coefficient, alphat |
|
Ycomp |
Compressive yield strength (force), Fc |
|
ytens |
Tensile yield strength (force), Ft |
3.5.2.4 PILE element parameters:
|
Density |
Mass density, ro |
|
Emod |
Young’s modulus, E |
|
Nu |
Poisson’s ratio, nu |
|
Pmoment |
Plastic moment capacity, Mp |
|
Thexp |
Thermal expansion coefficient, alphat |
|
Cs_scoh |
Shear coupling spring cohesion per unit length, cs |
|
Cs_sfric |
Shear coupling spring friction angle, Phis (º) |
|
Cs_sk |
Shear coupling spring stiffness per unit length, ks |
|
Cs_ncoh |
Normal coupling spring cohesion per unit length, cn |
|
Cs_nfric |
Normal coupling spring friction angle, phin (º) |
|
Cs_ngap |
Normal coupling spring gap-use flag, g (default: OFF) |
|
Cs_nk |
Normal coupling stiffness per unit length, kn |
|
Slide |
Large-strain sliding flag (default: OFF) |
|
Slide_to |
Large-strain sliding tolerance |
3.5.2.5 SHELL Element Parameters:
|
Tbeh |
Type of constitutive behavior
|
||||||||||
|
Ele |
Finite element type
|
||||||||||
|
Density |
Mass density, ro |
||||||||||
|
Emod |
Young's modulus, E (Isotropic) |
||||||||||
|
Nu |
Poisson's ratio, nu (Isotropic) |
||||||||||
|
E11 |
Orthotropic material property, e11 |
||||||||||
|
E12 |
Orthotropic material property, e12 |
||||||||||
|
E22 |
Orthotropic material property, e22 |
||||||||||
|
E33 |
Orthotropic material property, e33 |
||||||||||
|
Thexp |
Thermal expansion coefficient, alphat |
3.5.2.6 GEOG Element Parameters:
|
Tbeh |
Type of constitutive behavior
|
||||||||||
|
Ele |
Finite element type
|
||||||||||
|
Density |
Mass density, ro |
||||||||||
|
Emod |
Young’s modulus, E (Isotropic) |
||||||||||
|
Un |
Poisson’s ratio, un (Isotropic) |
||||||||||
|
E11 |
Orthotropic material property e11 |
||||||||||
|
E12 |
Orthotropic material property e12 |
||||||||||
|
E22 |
Orthotropic material property e22 |
||||||||||
|
E33 |
Orthotropic material property e33 |
||||||||||
|
Thexp |
Thermal expansion coefficient, alphat |
||||||||||
|
Cs_scoh |
Coupling spring cohesion (stress units), c |
||||||||||
|
Cs_sfric |
Coupling spring friction angle, phi (º) |
||||||||||
|
Cs_sk |
Coupling spring stiffness per unit area, k |
||||||||||
|
Slide |
Large-strain sliding flag (default: OFF) |
||||||||||
|
Slide_to |
Large-strain sliding tolerance |
3.5.2.7 LINER Element Parameters:
|
Tbeh |
Type of constitutive behavior
|
||||||||||
|
Ele |
Finite element type
|
||||||||||
|
Density |
Mass density, ro |
||||||||||
|
Emod |
Young's modulus, E (Isotropic) |
||||||||||
|
Nu |
Poisson's ratio, nu (Isotropic) |
||||||||||
|
E11 |
Orthotropic material property e11 |
||||||||||
|
E12 |
Orthotropic material property e12 |
||||||||||
|
E22 |
Orthotropic material property e22 |
||||||||||
|
E33 |
Orthotropic material property e33 |
||||||||||
|
Thexp |
Thermal expansion coefficient, alphat |
||||||||||
|
Cs_ncut |
Normal coupling spring tensile strength (stress units), ft |
||||||||||
|
Cs_nk |
Normal coupling spring stiffness per unit area, kn |
||||||||||
|
Cs_scoh |
Shear coupling spring cohesion (stress units), c |
||||||||||
|
Cs_scohr |
Shear coupling spring residual cohesion (stress units), cr |
||||||||||
|
Cs_sfric |
Shear coupling spring friction angle, phi (º) |
||||||||||
|
Cs_sk |
Shear coupling spring stiffness per unit area, ks |
||||||||||
|
Slide |
Large-strain sliding flag (default: OFF) |
||||||||||
|
Slide_to |
Large-strain sliding tolerance |
3.6 Active Properties
CivilFEM material properties are time dependent. This dependence is controlled by utilizing a global variable called active time (see ~ACTTIME command). This time is common to all materials and its value is fixed by the user at every moment. CivilFEM active time may or may not coincide with ANSYS time (ANSYS TIME command).
Additionaly, each definition of a CivilFEM material contains the material’s activation time which mandates the time at which the materials start to exist. Once both the active and the activation times are established, those materials whose activation time is not greater than the active time will be active. Those elements whose material is inactive, do not exist to any effect (either in CivilFEM or in ANSYS). The age of each material is calculated for any moment of time using the active time (ActTime) and activation instant values:
MatAge (Imat) = ActTime – TmAct (Imat)
|
MatAge: |
Material Age |
|
ActTime: |
Active Time |
|
TmAct: |
Material’s activation time |
|
Imat: |
Material taken into account |
This MatAge allows the calculation of any material property at any time simply by using an interpolation of the corresponding time dependent vectors. Each property is determined by its own interpolation procedure. When the user modifies the value of ActTime, all the mechanical properties (observed by ANSYS and CivilFEM) of the affected materials and cross-sections will be automatically updated.
3.7 Dependent Material Properties
In order to properly define and modify the material properties, the dependent parameters among them and the modifying priority order should be taken into consideration. The modifying priority order is adopted by the program to the automatically modify related properties.
If two or more related parameters have the same modifying priority order, the user can choose which one is to be modified and the program will update the remaining related parameters automatically. Related data having the same modifying priority order are called coupled data (this condition is represented by a double arrow in the following charts).
In the following tables, all of the material properties subjected to modifications as well as the order of priority among them are listed. The column on the left contains those material properties with a higher hierarchy (order of priority). When the user modifies these values, all of their dependent parameters (those being on the right column of the tables) will be modified and recalculated automatically by the program. It can be easily seen that parameters' dependence is nested. Therefore, a specific material property may have a higher hierarchy with regards to some parameters and a lower one regarding others.
Tables are divided according to property type: external data, general properties (concerning all materials), specific material properties (steel, concrete, reinforcement steel and prestressing steel) and code properties (properties depending on active code and material).
3.7.1 External Data
|
ActTime |
® |
MatAge |
3.7.2 General Properties
|
TAct |
® |
MatAge |
|
Ex |
® ® |
Gxy If material is reinforcement steel ® Structural and section stress-strain diagrams change. |
|
NUxy |
® |
Gxy |
|
RHO |
« |
GAM (coupled data) |
|
RHO |
® |
Ec (If ACI-318 code is active) |
|
VCos |
« |
Mcos « Wcos (coupled data) |
3.7.3 Structural Steel Specific Properties
|
ExLn |
® ® |
Ex Stress-strain diagrams (structural and sections) |
|
Nthk |
® ® ® ® ® ® ® ® ® |
Thik fy of Eurocode 3 fu of Eurocode 3 SIGe of EA code SIGu of EA code fy of LRFD fu of LRFD Ys of BS5950 (1985) Us of BS5950 (1985) |
|
Thik |
® |
Stress-strain diagrams (structural and sections) |
|
TSASSD |
® |
Structural Stress-strain diagrams |
|
TSDSSD |
® |
Sections Stress-strain diagrams |
|
PLRAT |
® |
Stress-strain diagrams (structural and sections) |
3.7.4 Concrete Specific Properties
|
Concrete Specific Properties |
||
|
Age_New(1)
|
® ® ® ® ® ® |
BETcc of Eurocode 2 fc_t of ACI BETcc of model code CEB BETc of EHE BETt of EHE BETcc of BS8110 |
|
MatAge |
® |
ExLn |
|
TpEx |
® |
ExLn |
|
ExLn |
® |
Ex |
(1) Age_Del and Age_Mov are similar to this parameter, that is to say, they are related to the same data and having equal hierarchy order.
3.7.5 Soil Specific Properties
|
TpEx |
® |
ExCal |
|
ExCal |
® |
Ex |
|
TpNuxy |
® |
NuxyCal |
|
NuxyCal |
® |
Nuxy |
|
TpRHO |
® |
RHOCal |
|
RHOCal |
® |
RHO |
|
ExSt |
® |
ExCal |
|
NuxySt |
® |
NuxyCal |
|
ExD |
® |
ExCal |
|
NuxyD |
® |
NuxyCal |
|
GAMd |
® ® ® ® ® |
GAMs GAMsat GAMap RHOd SW |
|
GAMs |
® |
RHOs |
|
GAMsat |
® ® |
GAMsub RHOsat |
|
GAMsub |
® |
RHOsub |
|
GAMap |
® |
RHOap |
|
GAMw |
® ® |
SW GAMsat |
|
RHOsub |
® |
RHOcal |
|
RHOap |
® |
RHOcal |
|
N |
® ® ® ® |
E GAMs GAMsat SW |
|
W |
® ® |
GAMap SW |
|
D10 |
® ® |
CCurv CUnif |
|
D60 |
® ® |
CCurv CUnif |
|
wl |
® |
Ip |
|
wp |
® |
Ip |
3.7.6 Rock Specific Properties
|
TpEx |
® |
ExCal |
|
ExCal |
® |
Ex |
|
TpNuxy |
® |
NuxyCal |
|
NuxyCal |
® |
Nuxy |
|
TpRHO |
® |
RHOCal |
|
RHOCal |
® |
RHO |
|
ExSt |
® |
ExCal |
|
NuxySt |
® |
NuxyCal |
|
ExD |
® |
ExCal |
|
NuxyD |
® |
NuxyCal |
|
GAMd |
® ® ® ® ® |
GAMs GAMsat GAMap RHOd SW |
|
GAMs |
® |
RHOs |
|
GAMsat |
® ® |
GAMsub RHOsat |
|
GAMsub |
® |
RHOsub |
|
GAMap |
® |
RHOap |
|
GAMw |
® ® |
SW GAMsat |
|
RHOsub |
® |
RHOcal |
|
RHOap |
® |
RHOcal |
|
N |
® ® ® ® |
E GAMs GAMsat SW |
|
W |
® ® |
GAMap SW |
|
GSI |
® ® |
HB_n HB_m HB_s |
|
HB_m0 |
® |
HB_m |
|
HB_s0 |
® |
HB_s0 |
3.7.7 Specific Code Properties
3.7.7.1 Specific Code Properties (Eurocode 3)
|
fy |
® |
Stress-strain diagrams (structural and sections) |
|
GAMM0 |
® |
Stress-strain diagrams for section analysis |
3.7.7.2 Specific Code Properties (EA)
|
GAMa |
® ® |
SIGu Stress-strain diagrams for section analysis |
|
SIGe |
® ® |
SIGu Stress-strain diagrams (structural and sections) |
3.7.7.3 Specific Code Properties (AISC-LRFD)
|
Fy |
® |
Stress-strain diagrams (structural and sections) |
3.7.7.4 Specific Code Properties (BS5950-1985 & 2001)
|
Ys |
® ® ® |
ROy Ke Stress-strain diagrams for structural analysis |
|
Us |
® ® ® |
ROy Ke Stress-strain diagrams for section analysis |
3.7.7.5 Specific Code Properties (Eurocode 2 – Concrete)
|
Cetp |
® |
s |
|
GAMc |
® ® ® |
fcd fcd_t Ecd |
|
fck |
® ® ® |
fcm fcd fctm |
|
fcm |
® |
fcm_t |
|
fctm |
® ® |
fctk_005 fctk_095 |
|
s |
® |
BETcc |
|
BETcc |
® |
fcm_t |
|
fcm_t |
® ® |
fck_t Stress-strain diagrams for structural analysis |
|
fck_t |
® ® |
fcd_t Ecm |
|
fcd_t |
® |
Stress-strain diagrams |
|
Ecm |
® ® ® ® |
ExLn (si TpEx = 3) Ec Ecd Stress-strain diagrams (SA:1) |
|
Ec |
® |
ExLn (si TpEx = 1) |
|
Ecd |
® |
ExLn (si TpEx = 4) |
|
EPSc1 |
® |
Stress-strain diagrams |
|
EPScu |
® |
Stress-strain diagrams |
|
ALP |
® |
Stress-strain diagrams |
|
TSASSD |
® |
Stress-strain diagrams |
|
TSDSSD |
® |
Stress-strain diagrams |
3.7.7.6 Specific Code Properties (Eurocode 2 – Reinforcing Steel)
|
GAMs |
® ® |
fyd Stress-strain diagrams |
|
fyk |
® ® ® |
fyd Duct Stress-strain diagrams |
|
fyd |
® |
Stress-strain diagrams |
|
ftk |
® ® |
Duct Stress-strain diagrams |
|
EPSuk |
® ® |
Duct Stress-strain diagrams |
3.7.7.7 Specific Code Properties (Eurocode 2 – Prestressing Steel)
|
GAMs |
® |
Stress-strain diagrams |
|
fpk |
® |
Stress-strain diagrams |
|
fp01k |
® |
Stress-strain diagrams |
|
EPSuk |
® |
Stress-strain diagrams |
3.7.7.8 Specific Code Properties (ACI – Concrete)
|
Cutp |
® |
a BET |
|
Cetp |
® ® |
a BET |
|
fc |
® ® |
fc_t BET1 |
|
a |
® |
fc_t |
|
BET |
® |
fc_t |
|
fc_t |
® ® ® ® |
fr Ec EPS0 Stress-strain diagrams |
|
Ec |
® ® |
ExLn (si TpEx = 1) EPS0 |
|
EPS0 |
® |
Stress-strain diagrams |
3.7.7.9 Specific Code Properties (ACI – Reinforcing Steel)
|
fy |
® |
Stress-strain diagrams |
3.7.7.10 Specific Code Properties (ACI – Pretressing Steel)
|
fpu |
® |
fpy |
|
fpy |
® |
Stress-strain diagrams |
|
StTp |
® |
fpy Rlcf1 |
3.7.7.11 Specific Code Properties (CEB-FIP – Concrete)
|
Cetp |
® |
s |
|
GAMc |
® ® |
fcd fcd_t |
|
fck |
® ® ® ® ® ® ® |
fcd fcm fctk_min fctk_max fctm EPScuB EPScuU |
|
fcm |
® ® ® ® |
fcm_t k Eci Ec1 |
|
fctm |
® |
k |
|
s |
® |
BETcc |
|
BETcc |
® ® ® |
fcm_t Eci Ec1 |
|
fcm_t |
® ® |
fck_t Stress-strain diagrams |
|
fck_t |
® ® ® |
fcd_t fcd1 fcd2 |
|
fcd_t |
® ® ® |
fcd1 fcd2 Stress-strain diagrams |
|
fcd2 |
® |
Stress-strain diagrams |
|
Eci |
® ® ® ® |
ExLn (si TpEx = 1) Ec EPSc_lim Stress-strain diagrams |
|
Ec |
® |
ExLn (si TpEx = 5) |
|
Ec1 |
® ® ® |
ExLn (si TpEx = 3) EPSc_lim Stress-strain diagrams |
|
EPSc1 |
® ® |
Ec1 Stress-strain diagrams |
|
EPSc_lim |
® |
Stress-strain diagrams |
|
EPScuB |
® ® |
EPSmin Stress-strain diagrams |
|
EPScuC |
® |
EPSmin |
|
EPScuU |
® |
EPSint |
|
TSDSSD |
® ® |
EPSmin EPSint |
3.7.7.12 Specific Code Properties (CEB-FIP – Reinforcing Steel)
|
GAMs |
® |
fyd |
|
fyk |
® ® ® |
fyd Duct Stress-strain diagrams |
|
fyd |
® |
Stress-strain diagrams |
|
ftk |
® |
Duct |
|
EPSuk |
® ® |
Duct Stress-strain diagrams |
3.7.7.13 Specific Code Properties (EHE – Concrete)
|
Cetp |
® |
k |
|
GAMc |
® ® |
fcd fcd_j |
|
fck |
® ® ® ® ® ® |
fcm fcd fctm fctk_005 fctk_095 fck_j |
|
fcm |
® ® ® |
Eci E0_j Ej |
|
fctm |
® |
fctm_j |
|
Eci |
® ® ® |
ExLn (si TpEx = 1) EPSclim Stress-strain diagrams |
|
k |
® |
BETc |
|
BETc |
® ® ® |
fck_j E0_j Ej |
|
fck_j |
® ® |
fcm_j fcd_j |
|
BETt |
® |
fctm_j |
|
fcm_j |
® ® |
EPSclim Stress-strain diagrams |
|
fcd_j |
® |
Stress-strain diagrams |
|
E0_j |
® |
ExLn (si TpEx = 2) |
|
Ej |
® |
ExLn (si TpEx = 3) |
|
EPSc1 |
® ® |
EPSclim Stress-strain diagrams |
|
EPSclim |
® |
Stress-strain diagrams |
3.7.7.14 Specific Code Properties (EHE – Reinforcing Steel)
|
GAMs |
® |
fyd |
|
fyk |
® ® ® |
fyd fmax Stress-strain diagrams |
|
fyd |
® ® |
fycd Stress-strain diagrams |
|
fmax |
® |
Stress-strain diagrams |
|
EPSmax |
® |
Stress-strain diagrams |
3.7.7.15 Specific Code Properties (EHE – Prestressing Steel)
|
GAMs |
® |
fpd |
|
fpk |
® ® |
fpd Stress-strain diagrams |
|
fpd |
® |
Stress-strain diagrams |
|
fmax |
® |
Stress-strain diagrams |
3.7.7.16 Specific Code Properties (BS8110 – Concrete)
|
Cetp |
® |
s |
|
GAMc |
® |
Stress-strain diagrams |
|
fcu |
® ® ® |
fcu_t Ec28 Ec_t |
|
EPSc1 |
® |
Stress-strain diagrams |
|
EPScu |
® |
Stress-strain diagrams |
|
s |
® |
BETcc |
|
BETcc |
® |
fcu_t |
|
fcu_t |
® |
Ec_t |
|
Ko |
® |
Ec28 |
|
Ec28 |
® |
Ec_t |
|
Ec_t |
® |
ExLn (if TpEx = 1) |
3.7.7.17 Specific Code Properties (BS8110 – Reinforcing Steel)
|
GAMs |
® |
Stress-strain diagrams |
|
fy |
® |
Stress-strain diagrams |
3.7.7.18 Specific Code Properties (GB50010 – Concrete)
|
Cetp |
® |
s |
|
GAMc |
® |
fc ft fc_t |
|
fcuk |
® ® ® ® ® ® ® ® ® ® |
Ec_t(NAge) ALPc1 ALPc2 fck fck_t(NAge) ftk n EPS0 EPScu Delta |
|
ALPc1 |
® |
fck |
|
ALPc2 |
® |
fck |
|
Delta |
® |
ftk |
|
fck |
® ® |
fck_t(NAge) fc |
|
ftk |
® |
ft |
|
s |
® |
BETcc(Nage) |
|
BETcc (Nage) |
® ® |
fcu_t(NAge) Ec_t(NAge) |
|
fck_t (Nage) |
® ® |
fc_t(NAge) Stress-strain diagrams |
|
fc_t (Nage) |
® |
Stress-strain diagrams |
|
Ec_t (Nage) |
® |
ExLn |
|
EPS0 (Nage) |
® ® |
EPSint Stress-strain diagrams |
|
EPScu (Nage) |
® ® |
EPSmin Stress-strain diagrams |
3.7.7.19 Specific Code Properties (GB50010 – Reinforcing Steel)
|
GAMs |
® |
fy |
|
Fyk |
® ® |
fy Stress-strain diagrams |
|
Fy |
® |
Stress-strain diagrams |
3.7.7.20 Specific Code Properties (NBR6118 – Concrete)
|
Eci |
® |
Ecs |
|
GAMc |
® ® |
fcd fcd_j |
|
Fck |
® ® ® ® ® ® ® |
fcm fcd fctm fctk_inf fctk_sup fcm_j fcd_j |
|
Sd |
® ® |
fcd_j fcm_j |
|
fck_j |
® ® |
fcd_j Eci |
|
Ex |
® |
Stress-strain diagrams |
|
fcd_j |
® |
Stress-strain diagrams |
3.7.7.21 Specific Code Properties (IS456 – Concrete)
|
Cetp |
® |
s |
|
GAMc |
® ® |
fcd fcd_t |
|
fck |
® ® ® ® |
fct fcd fck_t Ec |
|
BETcc |
® |
fck_t |
|
fck_t |
® ® |
fcd_t Ec_t |
|
s |
® |
BETcc |
|
BETcc |
® |
fcm_t |
|
fcd_t |
® |
Stress-strain diagrams |
|
Ec_t |
® |
TpEx |
3.7.7.22 Specific Code Properties (IS456 – Reinforcing Steel)
|
GAMs |
® ® |
fyd Stress-strain diagrams |
|
fyk |
® ® |
fyd Stress-strain diagrams |
|
TSASSD |
® ® |
Stress-strain diagrams KPLA |
|
TSDSSD |
® |
Stress-strain diagrams |
3.7.7.23 Specific Code Properties (SP 52-101-03 / SP 63.13330.2012– Concrete)
|
Cetp |
® |
s |
|
GAMb |
® ® |
Rb Rb_t |
|
GAMbt |
® |
Rbt |
|
Rbtn |
® |
Rbt S65_FT |
|
Rbn |
® ® |
Rbn_t Eb |
|
s |
® |
BETcc |
|
BETcc |
® |
Rbn_t |
|
Rbn_t |
® ® ® |
Rb_t Eb S65_fc |
|
Rb_t |
® |
Stress-strain diagrams |
|
Eb |
® |
TpEx |
|
EPSb0 |
® ® |
Stress-strain diagrams EPSmin |
|
TSASSD |
® ® |
Stress-strain diagrams KPLA |
|
TSDSSD |
® |
Stress-strain diagrams |
3.7.7.24 Specific Code Properties (SP 52-101-03/ SP 63.13330.2012 – Reinforcing Steel)
|
GAMs |
® |
Rs |
|
Rsn |
® |
Rs |
|
Rs |
® ® |
Stress-strain diagrams Rsw |
|
EPSs2 |
® |
Stress-strain diagrams |
|
TSASSD |
® ® |
Stress-strain diagrams KPLA |
|
TSDSSD |
® |
Stress-strain diagrams |